Tell us about the job
Takes about a minute. No obligation.
A contractor quoting a heat pump installation in Fountain County has to work out what the existing system was actually up against before settling on equipment and placement. 45 severe weather events were recorded in Fountain County, Indiana between 2015 and 2024. At that rate, severe weather is an occasional fact of life here rather than a constant one, which means the load a new system is built to handle comes mostly from ordinary heating and cooling demand, not from storm stress. Sizing decisions, refrigerant line routing, and electrical preparation are driven by the house itself and how well the previous install was done.
Ductwork laid down for a furnace-and-central-AC setup carries air on a different set of assumptions than a heat pump requires, and in Fountain County a significant share of the housing stock was built under exactly those assumptions. Half the homes in Fountain County, Indiana were built in 1966 or earlier (2020-2024 ACS 5-year). A contractor sizing a heat pump here has to look at what the existing trunk lines and branch runs can actually deliver before the equipment selection means anything, because a system that moves heat year-round at lower temperature differentials puts different demands on duct capacity than the original installation anticipated. Electrical service gets the same scrutiny: the panel that fed a gas furnace with a small blower may not carry what a heat pump draws.
What a Heat Pump Installation Covers
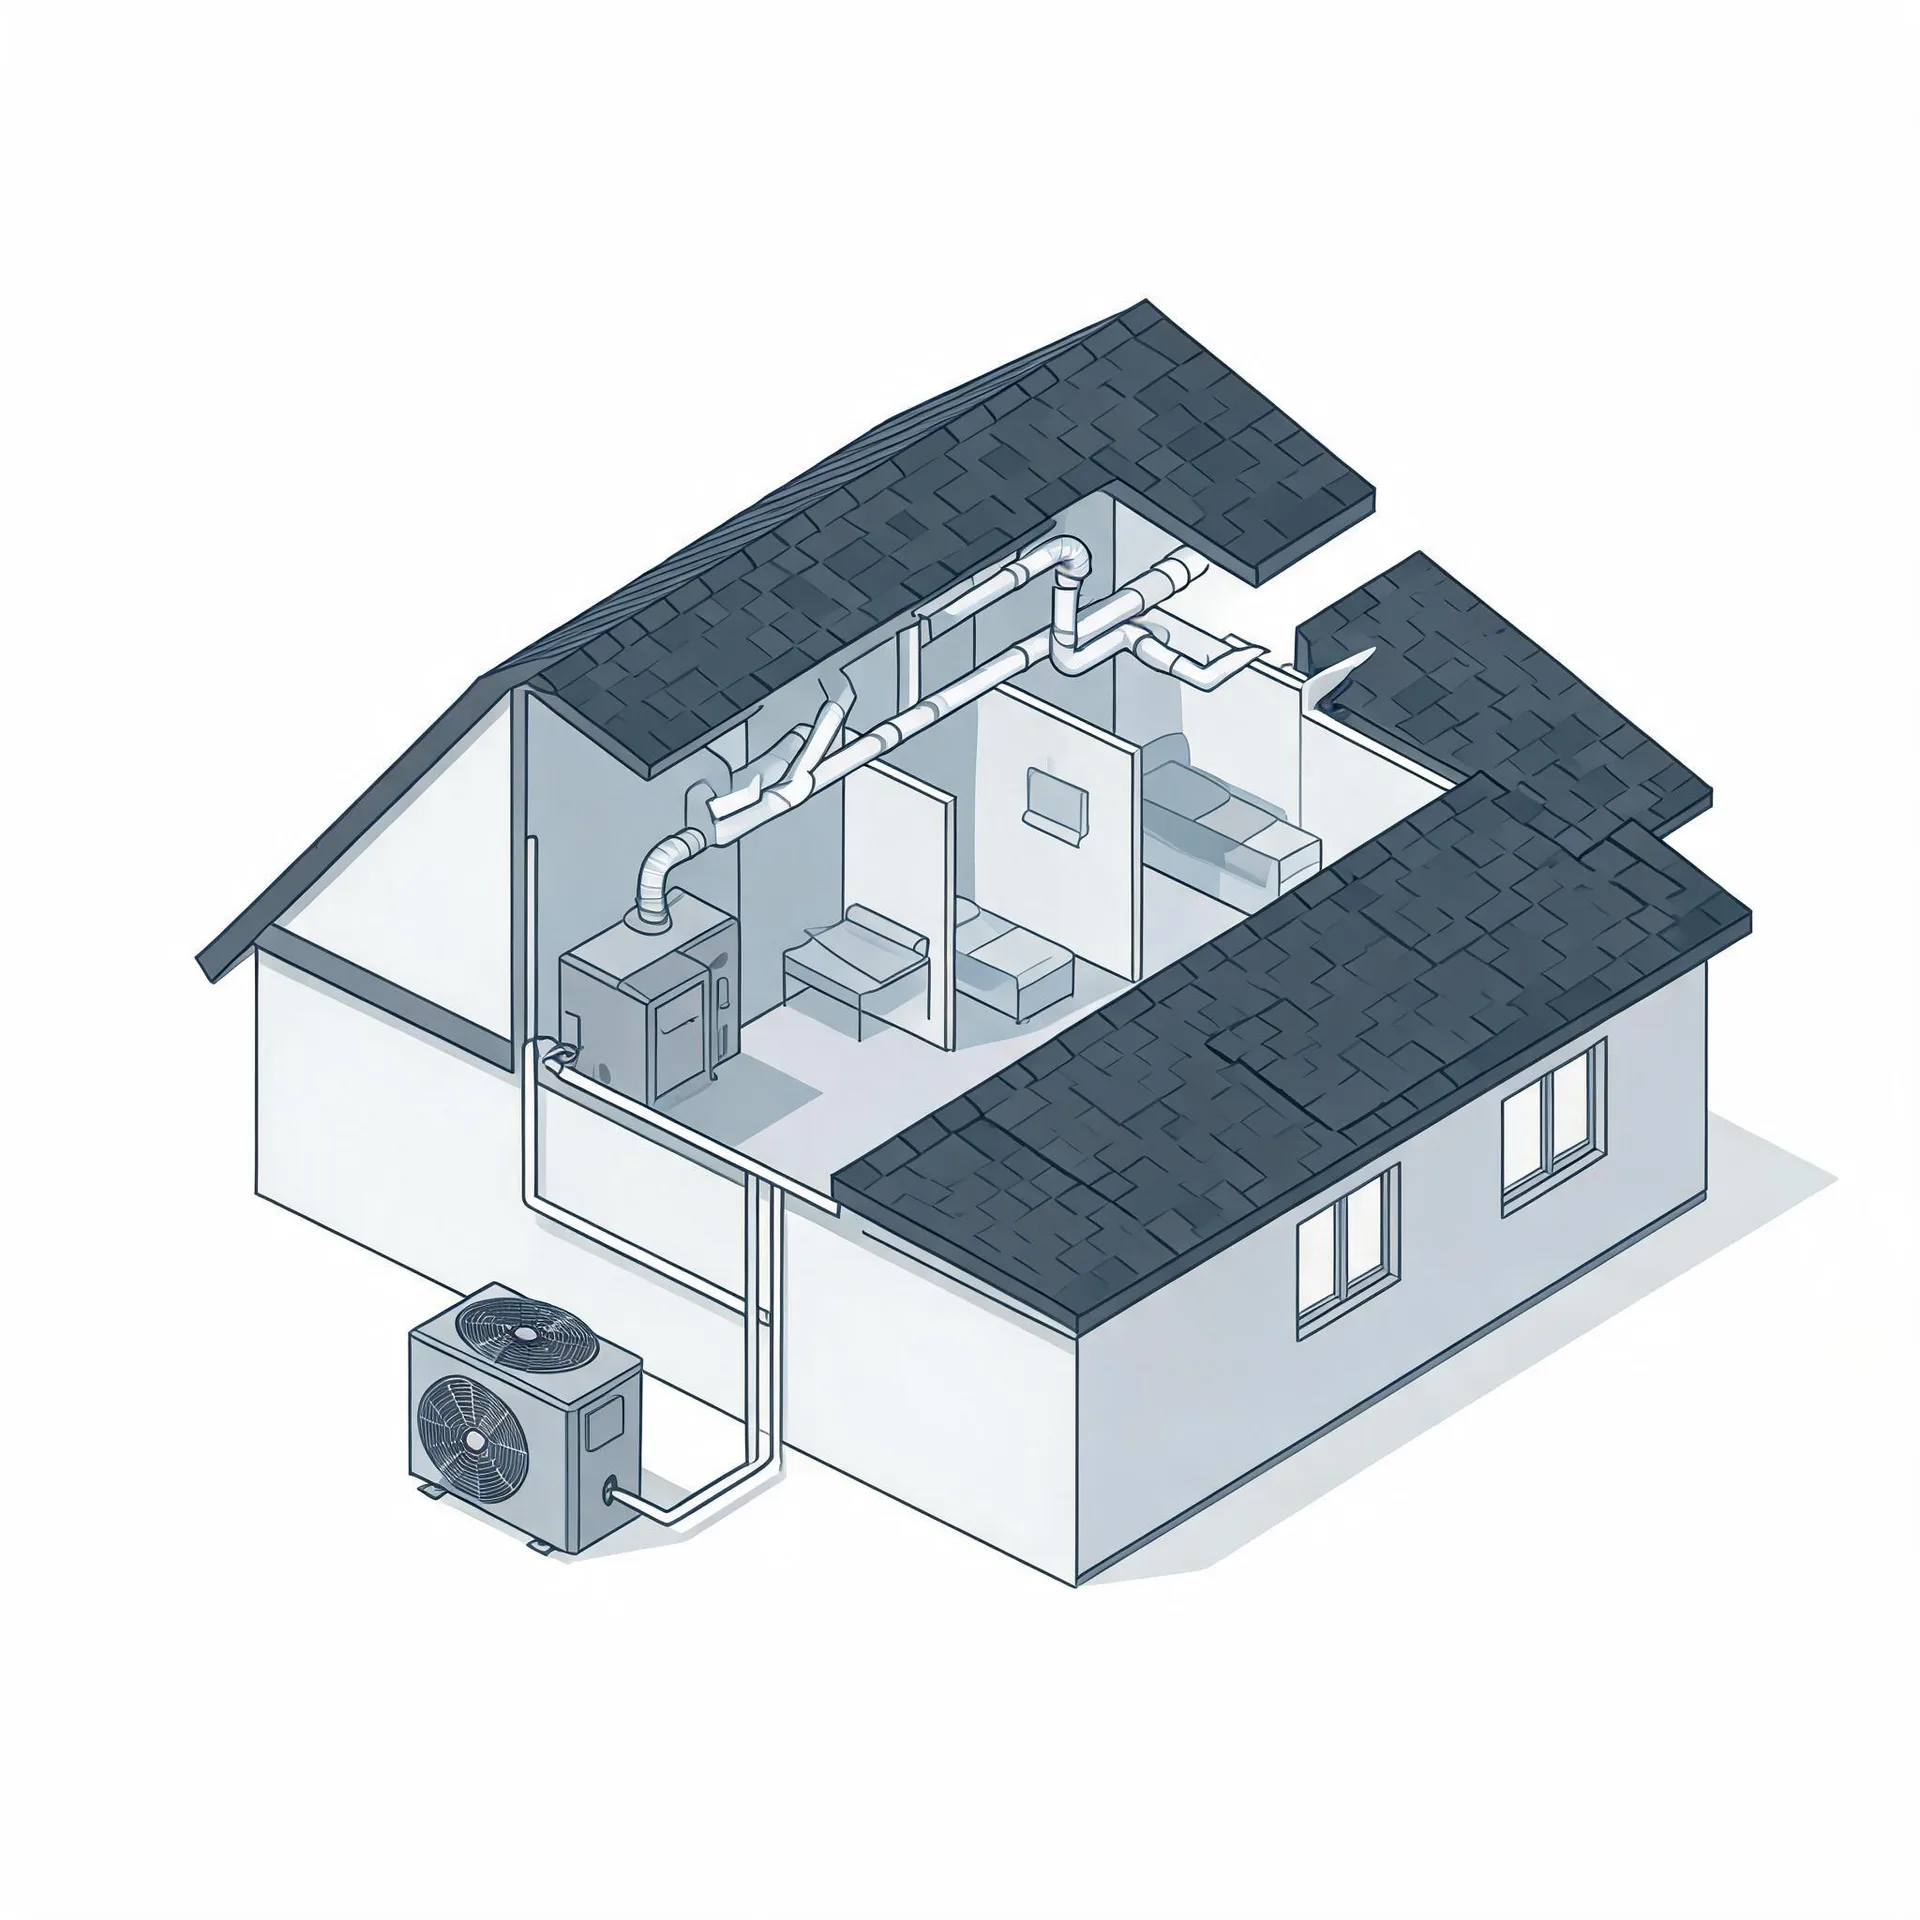
The outdoor unit sits on a pad beside the house and holds the compressor and the condenser coil, which are the pieces doing the heaviest work. Inside, the air handler mounts in a utility space, closet, or attic and moves conditioned air through the home. Together these two units are what a contractor sets in place.
A refrigerant line set runs between the two units, connecting the outdoor pad to the air handler and carrying the working fluid the system depends on. A thermostat goes on an interior wall where it reads the home's temperature and tells the system when to run.
The drawing shows a typical layout, and a licensed contractor determines exactly what applies to your house.
Find a contractor in Fountain CountyFountain County by the Numbers
45 severe weather events were recorded in Fountain County, Indiana between 2015 and 2024.
NOAA National Centers for Environmental Information, Storm Events Database, bulk CSV export, events 2015-01-01 through 2024-12-31.Half the homes in Fountain County, Indiana were built in 1966 or earlier (2020-2024 ACS 5-year).
U.S. Census Bureau, 2020-2024 American Community Survey 5-Year EstimatesFountain County, Indiana holds 7,875 housing units (2020-2024 ACS 5-year).
U.S. Census Bureau, 2020-2024 American Community Survey 5-Year EstimatesOwners occupy 74.6% of the occupied homes in Fountain County, Indiana (2020-2024 ACS 5-year).
U.S. Census Bureau, 2020-2024 American Community Survey 5-Year EstimatesSevere Weather Events in Fountain County
How hard heating and cooling equipment works is shaped by what the weather demands of it, and that demand is local. A heat pump sized and installed for conditions in Fountain County is a different conversation than one built for somewhere else.
45 severe weather events, 2015–2024. Source: NOAA National Centers for Environmental Information, Storm Events Database.