Tell us about the job
Takes about a minute. No obligation.

A contractor quoting a heat pump install in Martin County starts with the house: its age, its insulation, how the existing ductwork sits. 38 severe weather events were recorded in Martin County, Indiana between 2015 and 2024. At that rate, severe weather is a real but infrequent pressure on equipment here, and it does not drive sizing the way it would in a county that sees storms as a standing condition. What shapes the install quote is the building itself, and a contractor who gets that wrong produces a system that runs harder than it should from day one.
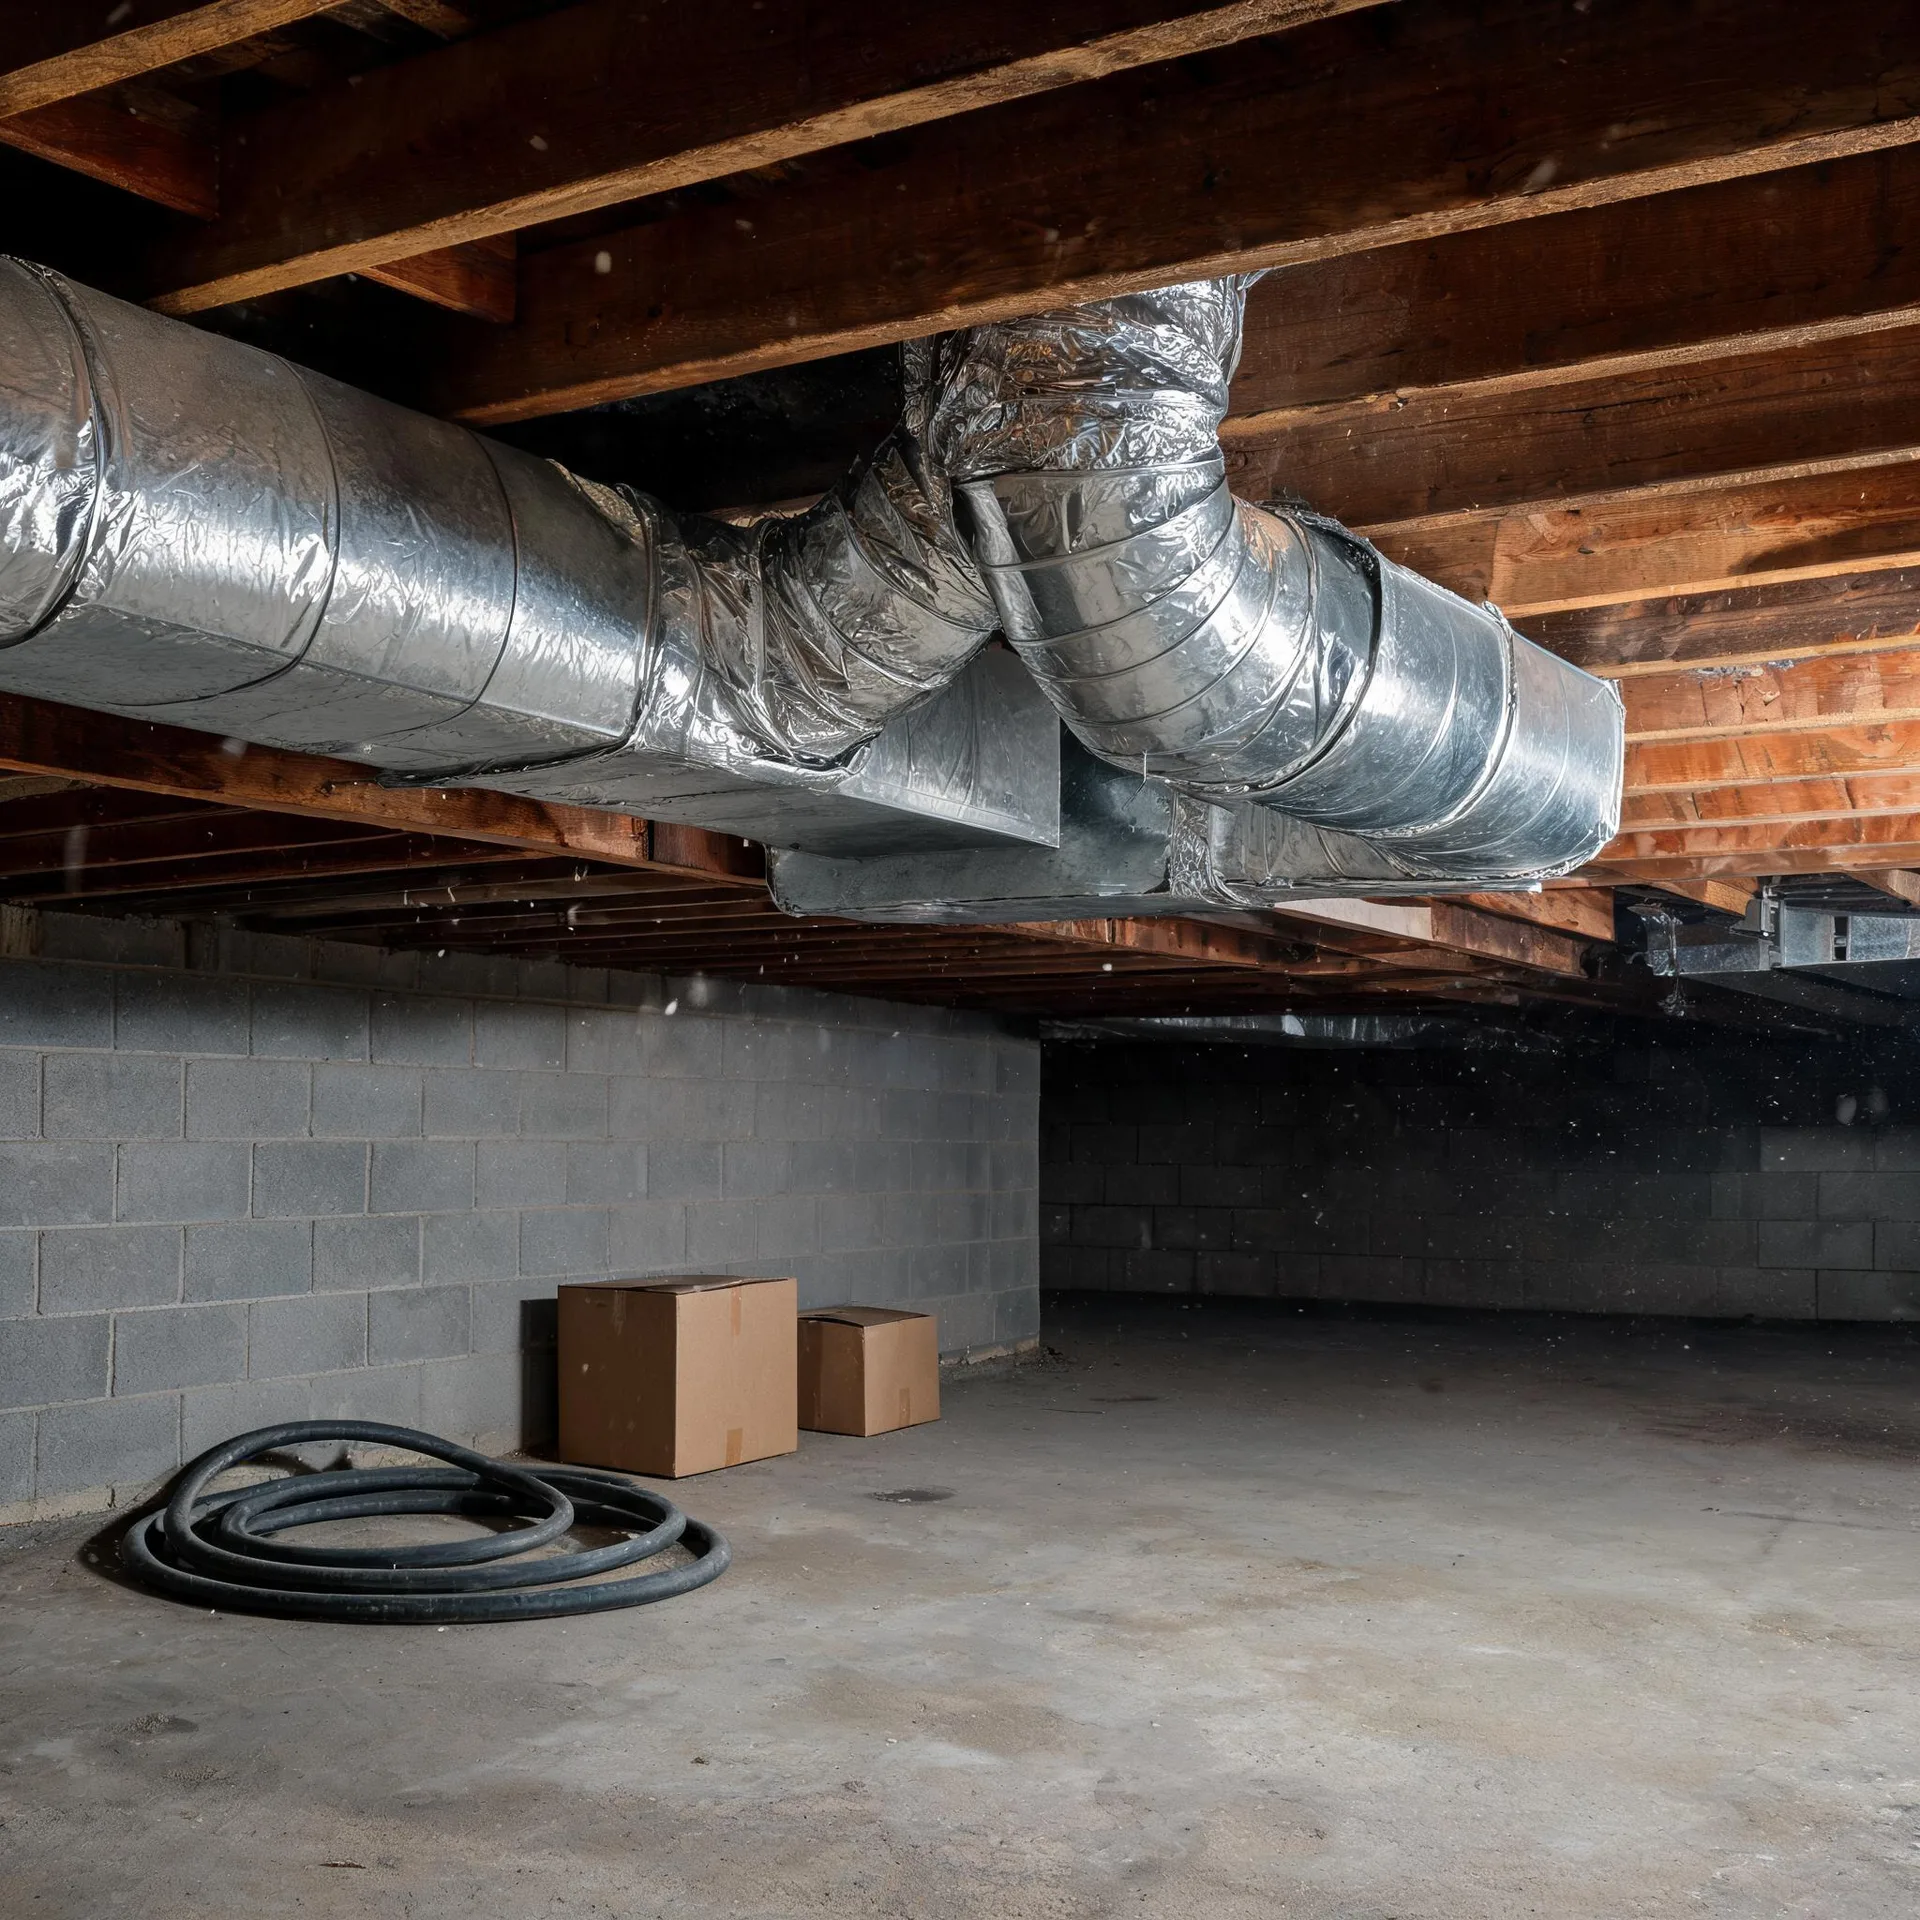
Ductwork laid out for a furnace follows a different logic than what a heat pump needs to move conditioned air through a house. Half the homes in Martin County, Indiana were built in 1981 or earlier (2020-2024 ACS 5-year). That means a contractor arriving to install a heat pump is working through a distribution system designed around equipment long since replaced, checking whether the runs, the returns, and the electrical service can carry what the new unit will actually demand. If the ductwork cannot, the scope of the job changes before the unit is ever ordered.
What a Heat Pump Installation Puts in Your Home
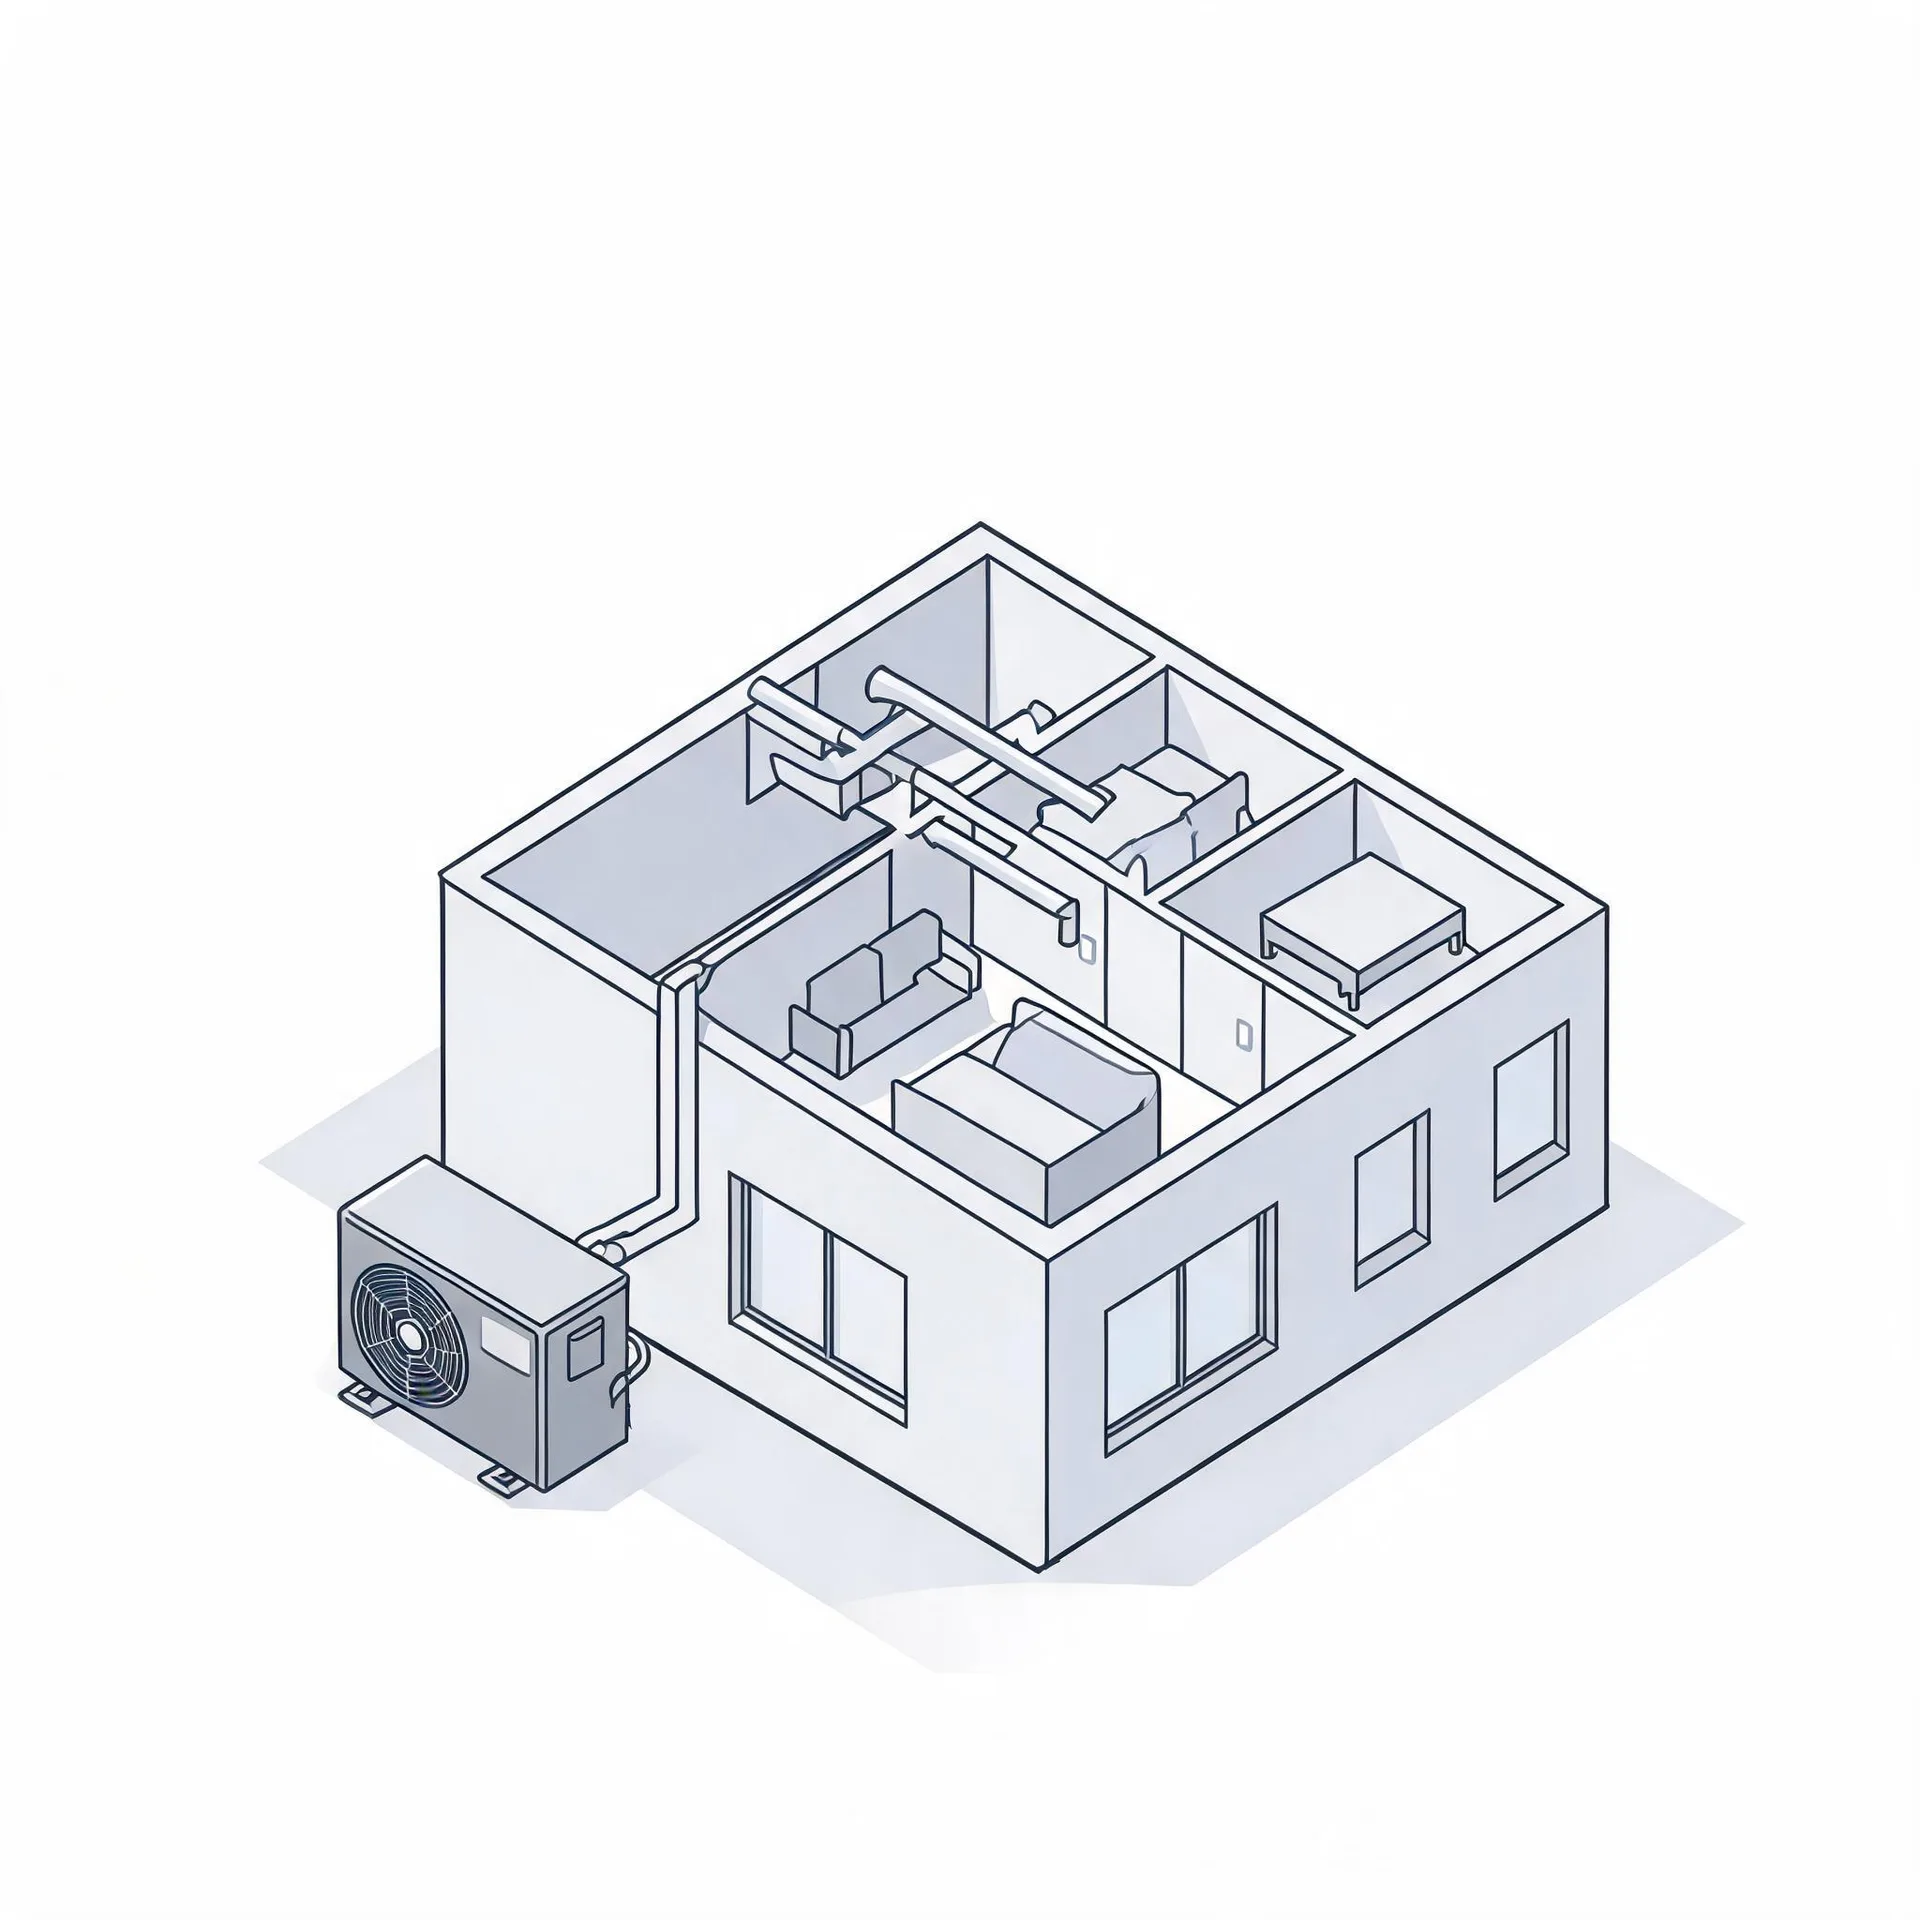
The outdoor unit is the piece most homeowners see first, sitting on a pad beside the house. Inside, an air handler mounts in a utility space, a closet, or an attic and circulates conditioned air through the home. Together those two units are what a new heat pump installation puts in place.
A refrigerant line set runs between the outdoor unit and the air handler, connecting the two through an exterior wall. A thermostat goes on an interior wall where it reads the home's temperature and tells both units what to do. A condensate drain line also runs from the air handler to carry away moisture the system pulls from the air.
The drawing shows a typical layout, and a licensed contractor determines exactly how each piece is positioned and routed in your house.
Find a contractor in Martin CountyMartin County, Indiana, by the numbers
38 severe weather events were recorded in Martin County, Indiana between 2015 and 2024.
NOAA National Centers for Environmental Information, Storm Events Database, bulk CSV export, events 2015-01-01 through 2024-12-31.Half the homes in Martin County, Indiana were built in 1981 or earlier (2020-2024 ACS 5-year).
U.S. Census Bureau, 2020-2024 American Community Survey 5-Year EstimatesMartin County, Indiana holds 4,583 housing units (2020-2024 ACS 5-year).
U.S. Census Bureau, 2020-2024 American Community Survey 5-Year EstimatesOwners occupy 78.5% of the occupied homes in Martin County, Indiana (2020-2024 ACS 5-year).
U.S. Census Bureau, 2020-2024 American Community Survey 5-Year EstimatesSevere Weather Events in Martin County
Heating and cooling equipment in Martin County works against whatever the local climate throws at it, and that workload shapes what a heat pump needs to handle year after year. How hard a system runs, and how well it holds up, is a local question before it is a mechanical one.
38 severe weather events, 2015–2024. Source: NOAA National Centers for Environmental Information, Storm Events Database.