Tell us about the job
Takes about a minute. No obligation.
Sizing a heat pump for Jackson County starts with what the local climate actually demands, and that picture is less extreme than contractors find in heavier weather markets. 49 severe weather events were recorded in Jackson County, Indiana between 2015 and 2024. At that rate, severe weather is an event here, not a constant condition, which means installation quality and proper load calculation carry more weight than storm exposure when a system underperforms. A contractor who gets the sizing wrong will produce a system that short-cycles or struggles on cold nights, and the weather record gives no cover for that outcome.
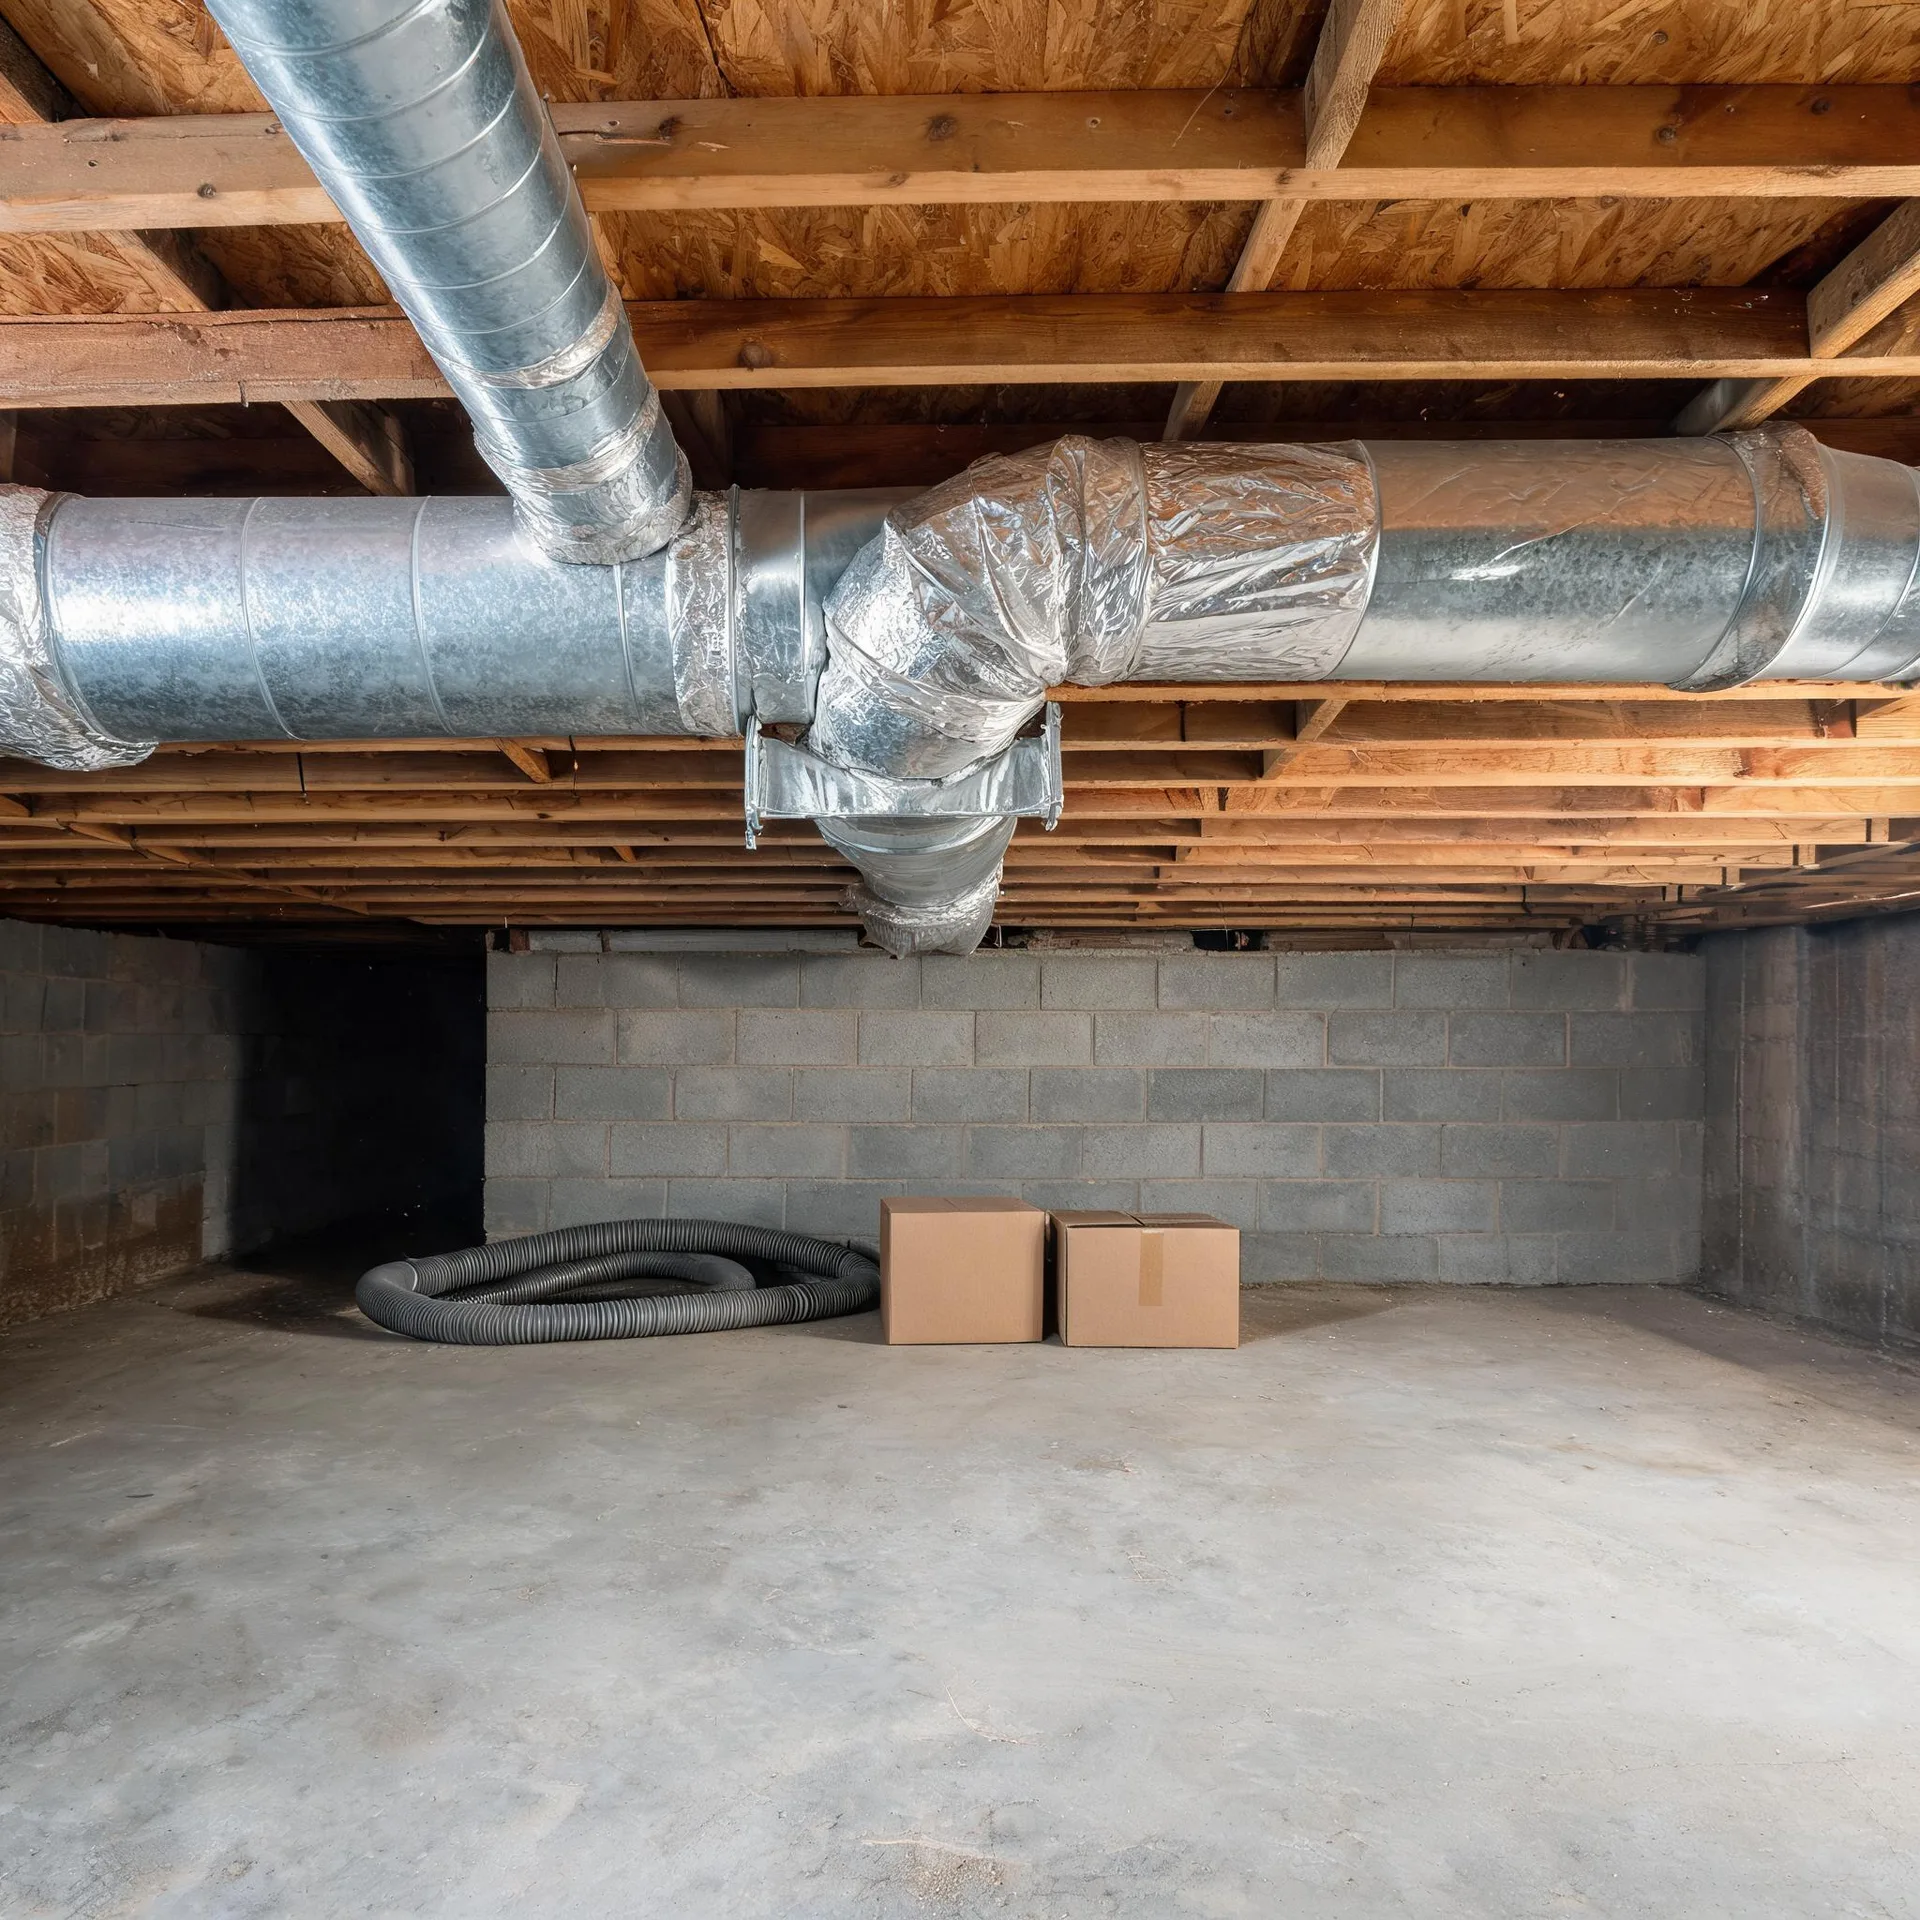
Ductwork laid down for a furnace carries air differently than a heat pump needs it to. Half the homes in Jackson County, Indiana were built in 1978 or earlier (2020-2024 ACS 5-year). That gap between when the house was built and what a contractor is now asked to put in it is where a heat pump installation either works cleanly or requires additional scope, and the ductwork is the first thing a contractor has to assess and measure before the equipment choice is settled.
What a Heat Pump Installation Covers
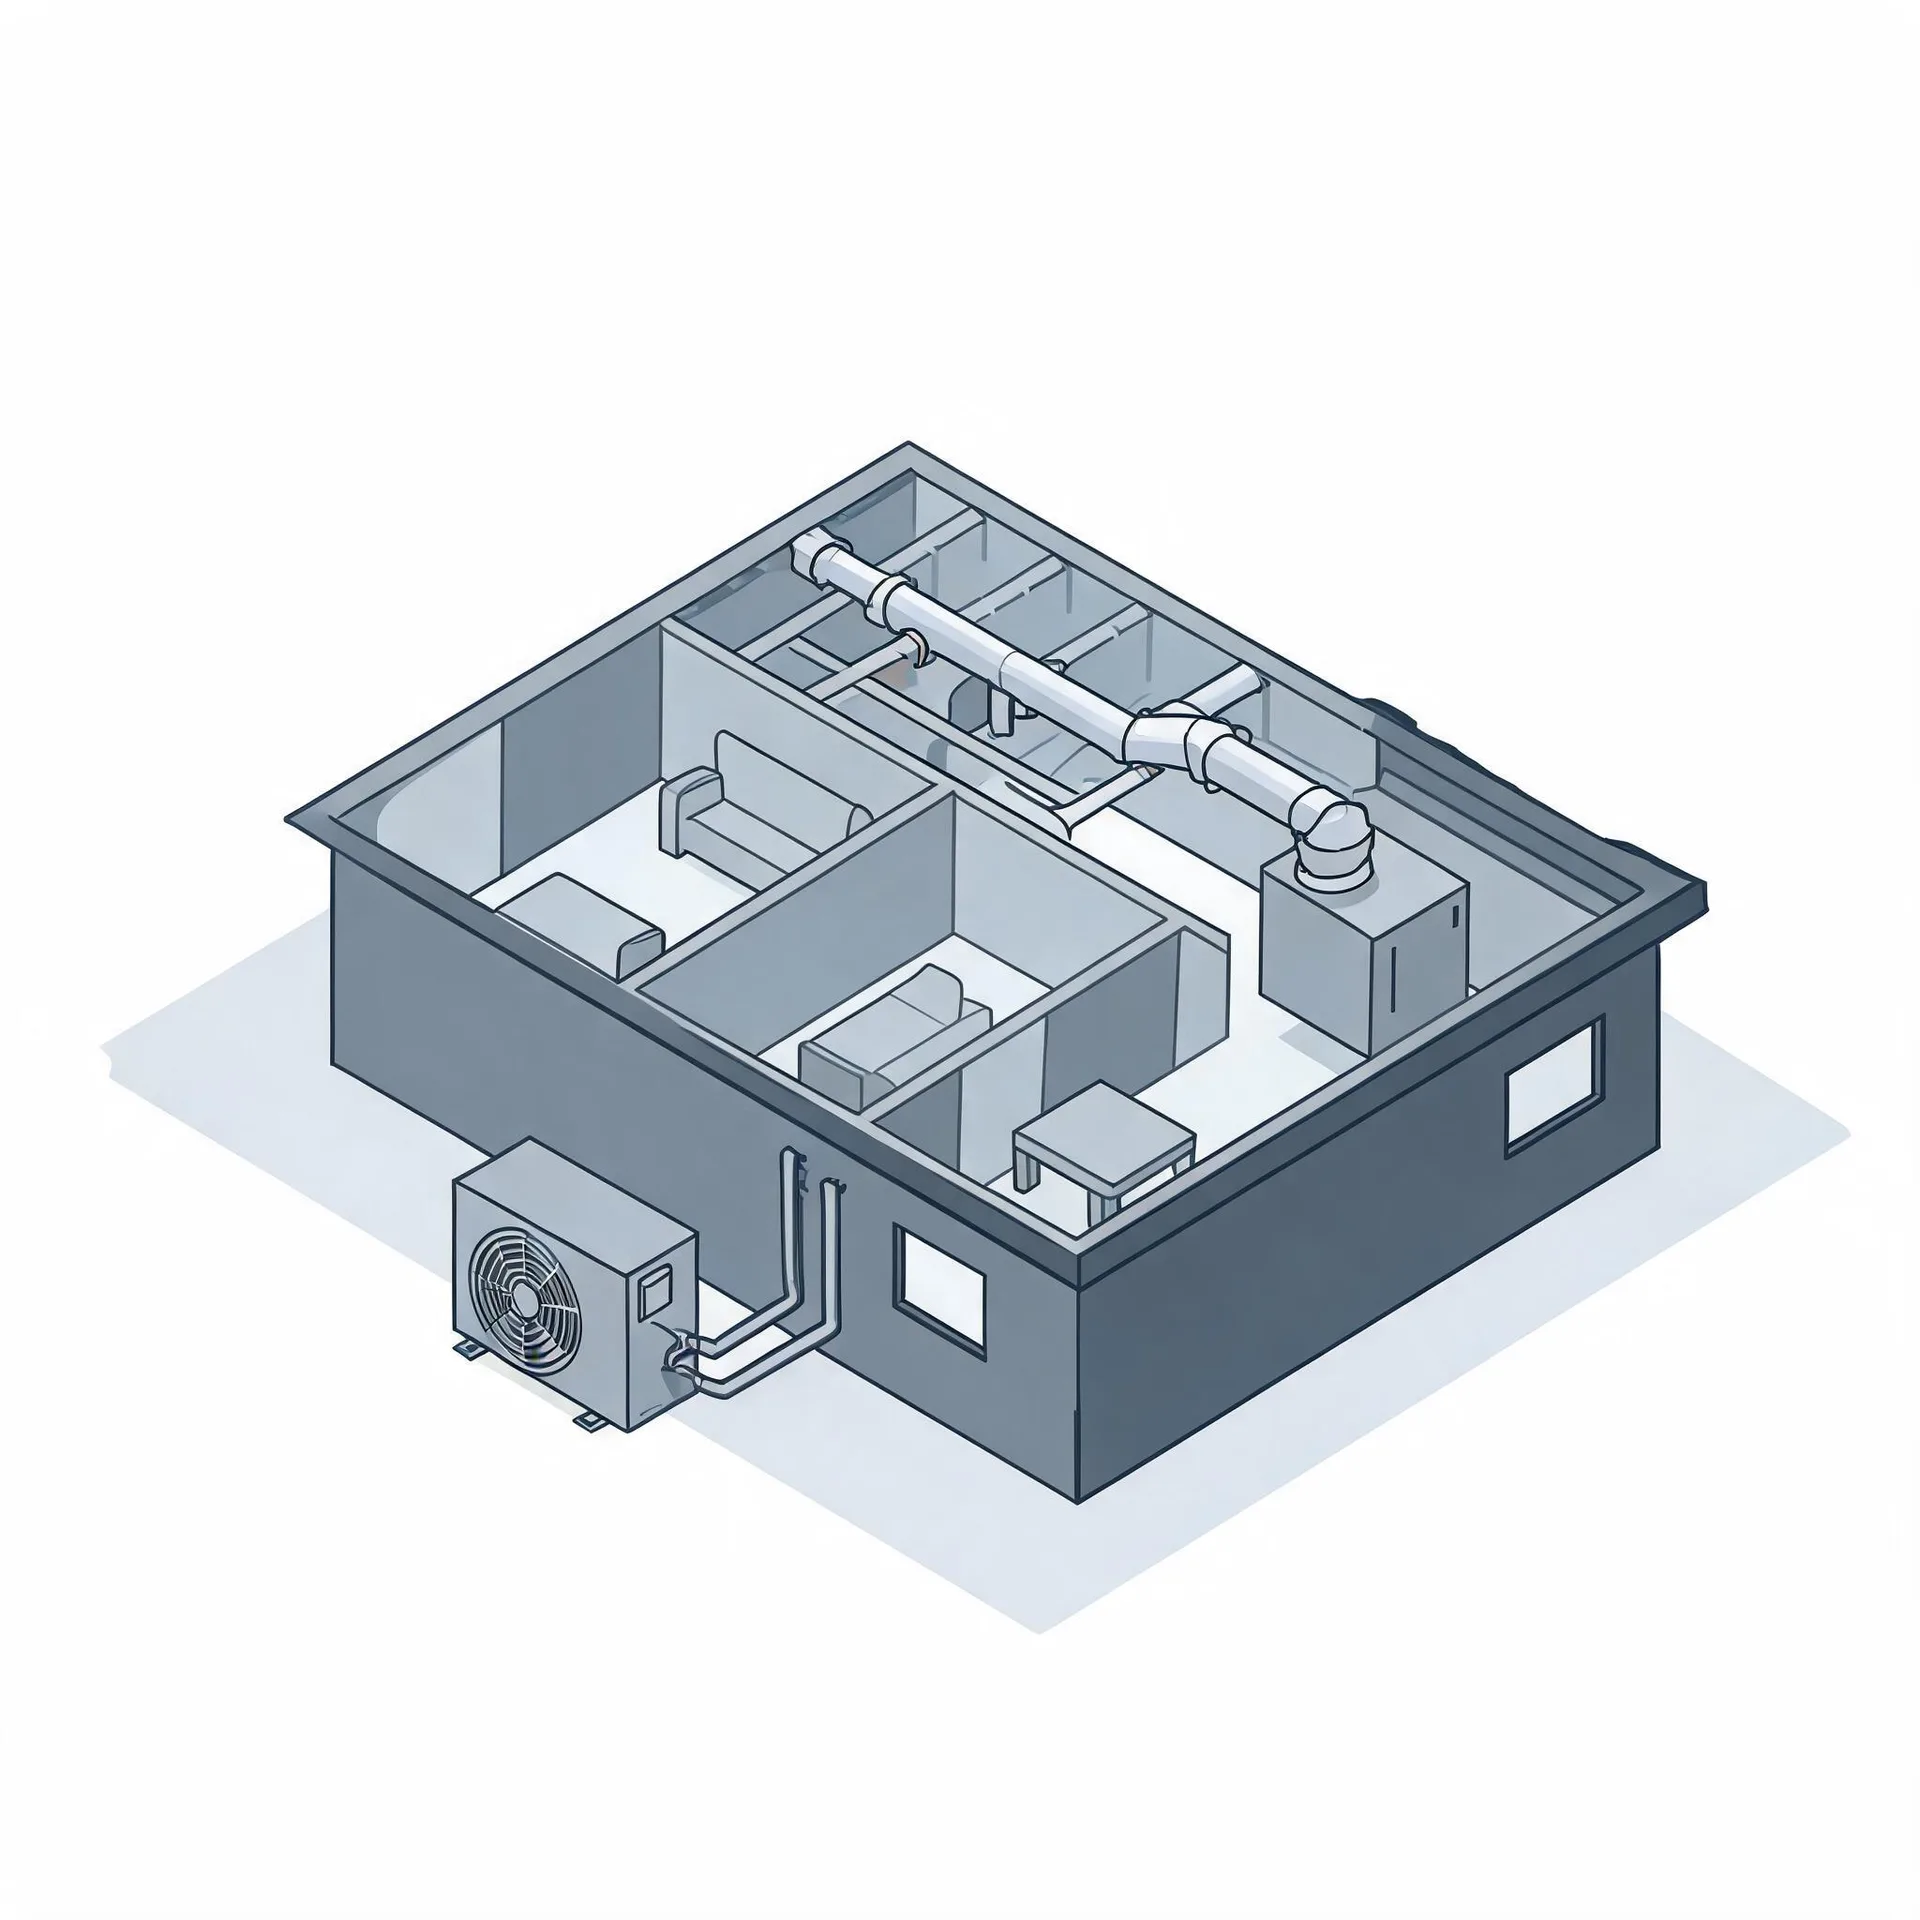
The outdoor unit sits on a pad beside the house and holds the compressor and the coil that exchange heat with the outside air. Inside, the air handler mounts in a utility space, a closet, or an attic and moves conditioned air through the home. These two units are the core of what a contractor installs.
A refrigerant line set runs between the outdoor unit and the air handler, carrying the working fluid that connects the two sides of the system. A thermostat goes on an interior wall where it reads the living space and signals the system to run. The contractor also installs the condensate drain line that carries moisture away from the air handler.
The drawing beside this text shows the general layout of these components, and a licensed contractor determines exactly what applies to your house and how each piece is positioned within it.
Find a contractor in Jackson CountyJackson County, Indiana, by the numbers
49 severe weather events were recorded in Jackson County, Indiana between 2015 and 2024.
NOAA National Centers for Environmental Information, Storm Events Database, bulk CSV export, events 2015-01-01 through 2024-12-31.Half the homes in Jackson County, Indiana were built in 1978 or earlier (2020-2024 ACS 5-year).
U.S. Census Bureau, 2020-2024 American Community Survey 5-Year EstimatesJackson County, Indiana holds 19,351 housing units (2020-2024 ACS 5-year).
U.S. Census Bureau, 2020-2024 American Community Survey 5-Year EstimatesOwners occupy 73.2% of the occupied homes in Jackson County, Indiana (2020-2024 ACS 5-year).
U.S. Census Bureau, 2020-2024 American Community Survey 5-Year EstimatesSevere Weather Events in Jackson County
Heating and cooling equipment in Jackson County works against whatever the local climate throws at it, and that workload shapes what gets installed and how it gets sized. A heat pump spec that ignores local weather patterns is a guess.
49 severe weather events, 2015–2024. Source: NOAA National Centers for Environmental Information, Storm Events Database.