Tell us about the job
Takes about a minute. No obligation.
Sizing a heat pump for a Madison County home starts with what the climate actually asks of the system, not what a catalog says a home of that square footage needs. 121 severe weather events were recorded in Madison County, Indiana between 2015 and 2024. At that rate, severe weather is part of the normal operating year, not an outlier, and a contractor who ignores that will undersize the equipment or pick refrigerant curves that do not match peak demand. The spec that works in a calmer county may leave this house running in defrost mode through stretches it should handle cleanly.
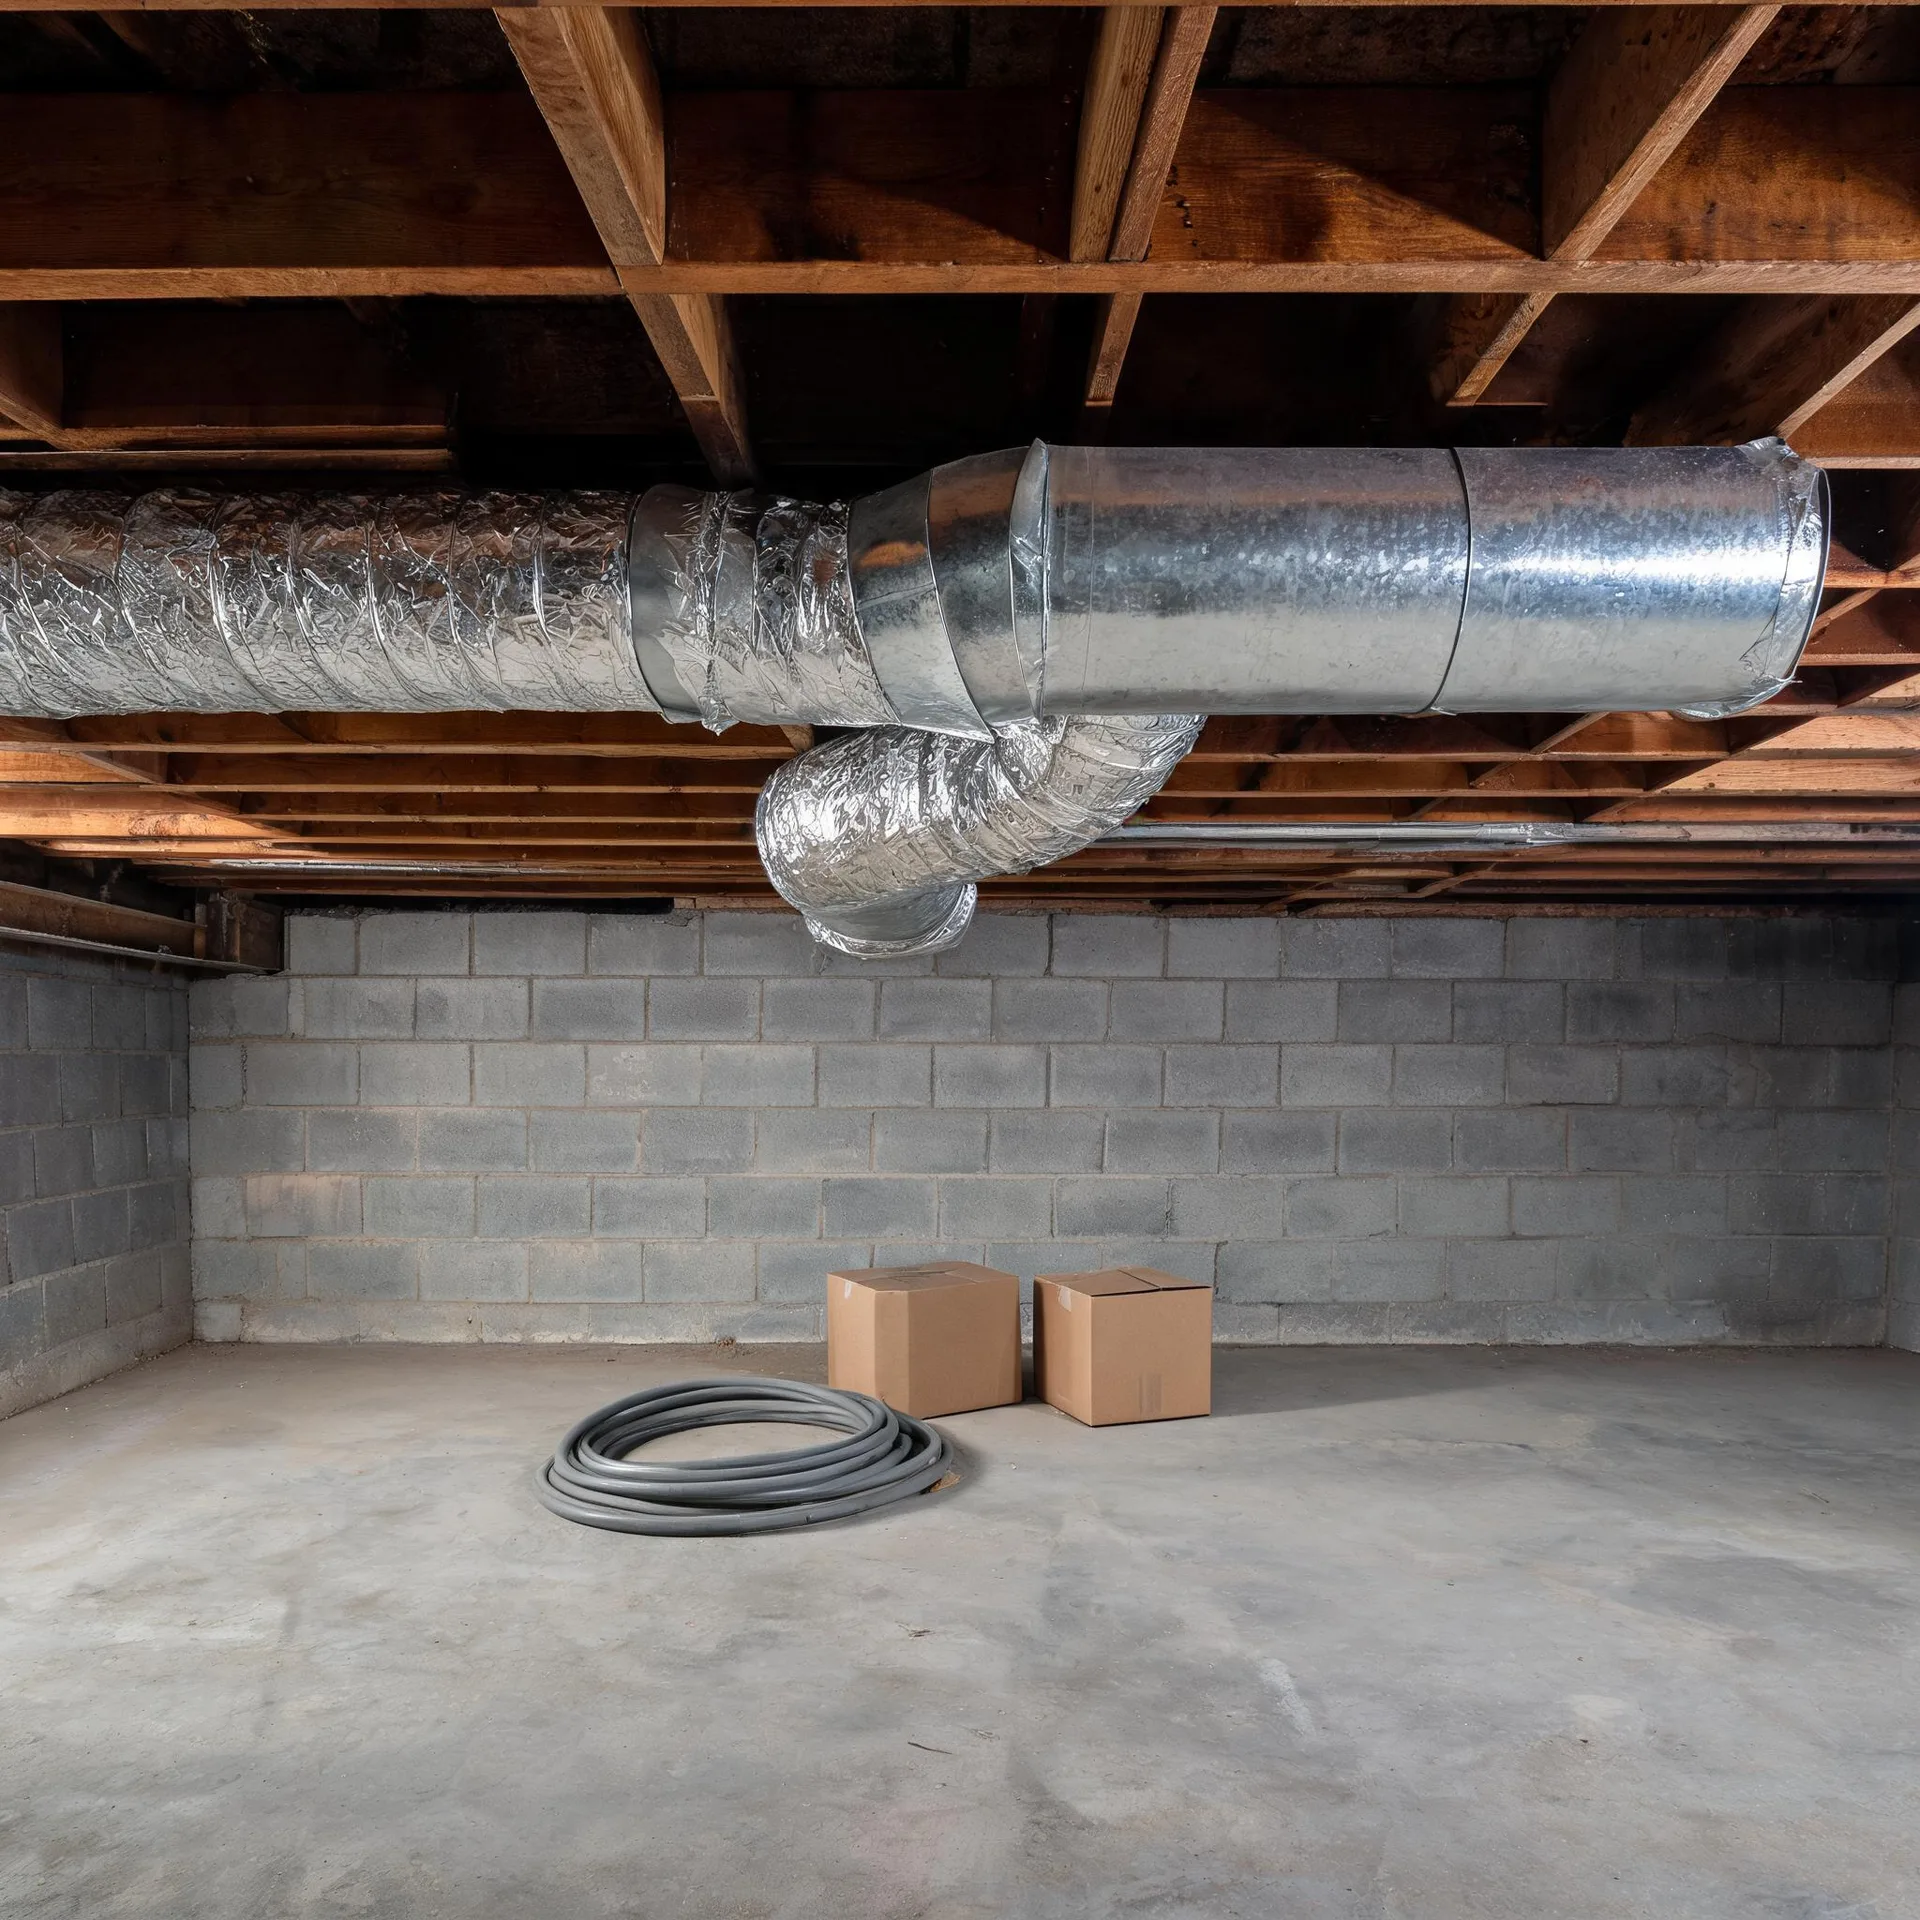
Ductwork laid out for a furnace and central air setup carries different pressures and flows than a heat pump needs. Half the homes in Madison County, Indiana were built in 1965 or earlier (2020-2024 ACS 5-year). A contractor sizing and installing a heat pump here has to assess whether the existing distribution system will actually move conditioned air the way the new unit is engineered to move it, and electrical service in housing of that era was wired for different loads than a modern heat pump draws. Those two questions, the duct layout and the panel, are where the install plan either holds or changes.
What a Heat Pump Installation Puts in Your Home
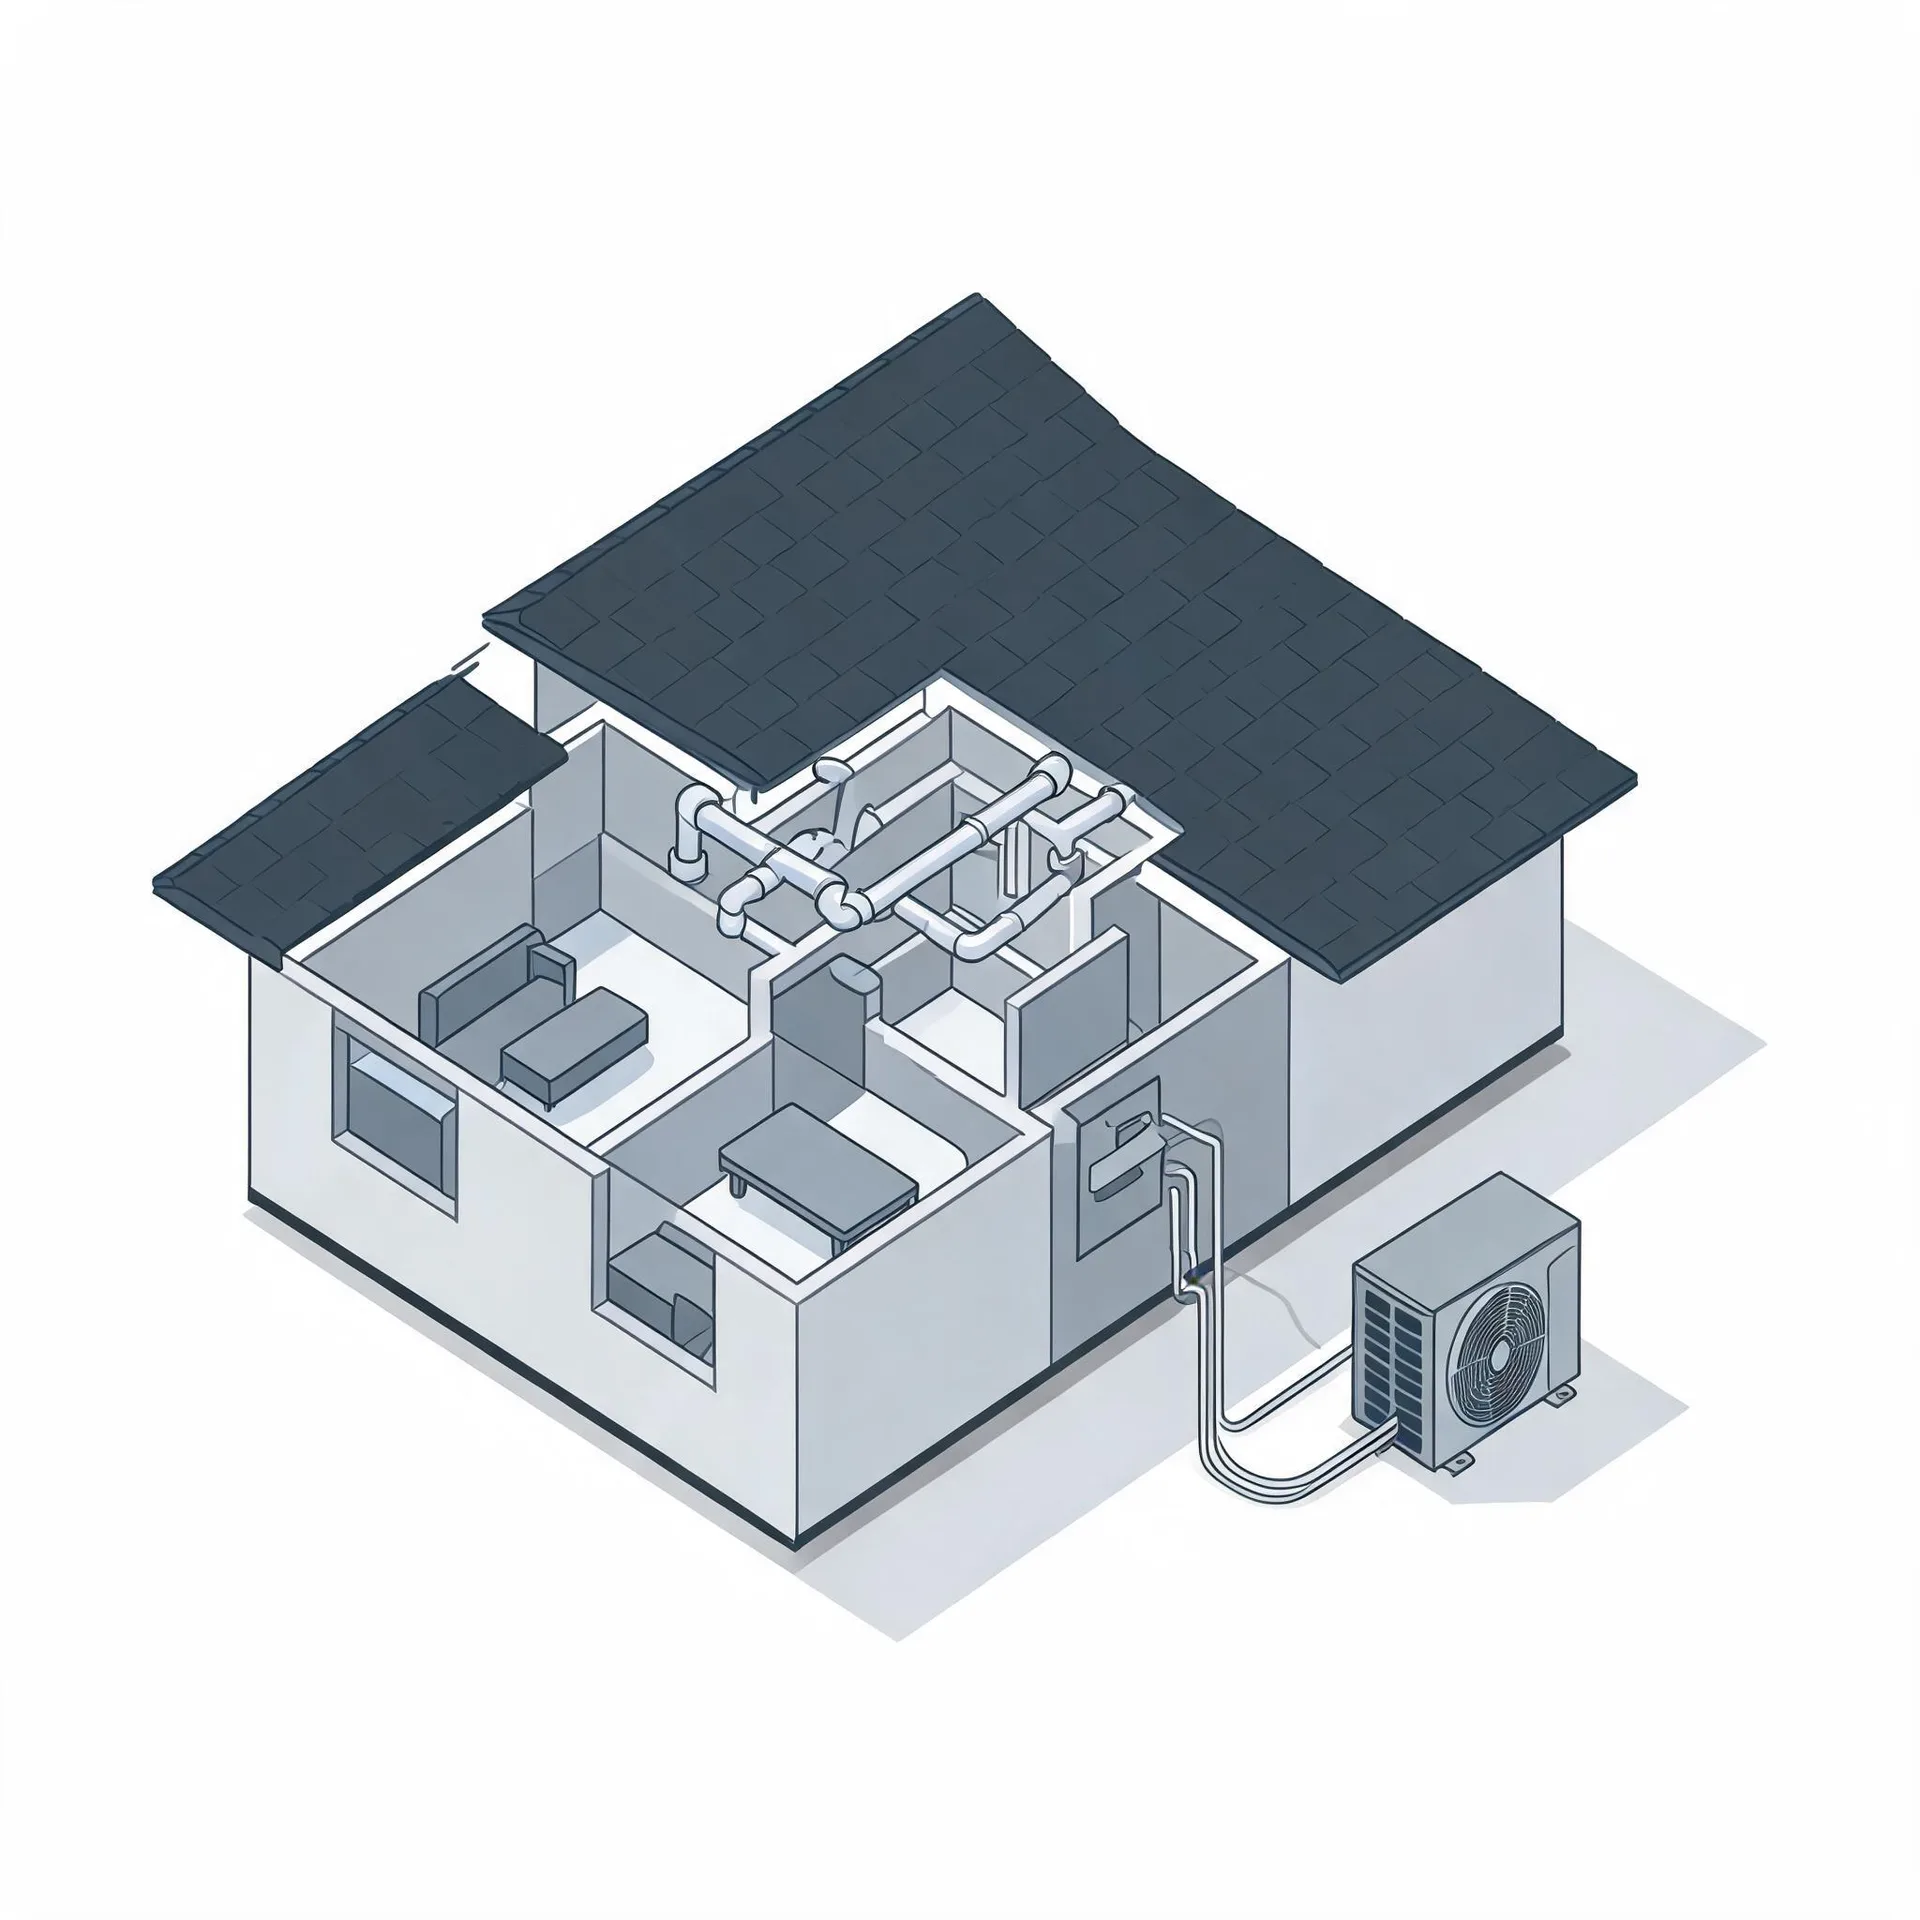
The outdoor unit is the piece most homeowners notice first. It sits on a pad beside the house and holds the compressor and the coil that exchange heat with the outside air. Inside, the air handler mounts in a utility space, closet, or attic and moves conditioned air through the home.
A refrigerant line set connects the two units, running between the outdoor pad and the air handler through the wall or floor. A thermostat goes on an interior wall where it reads the home's temperature and tells the system when to run.
The drawing shows the general layout of these components, and a licensed contractor determines what applies to this particular house.
Find a contractor in Madison CountyMadison County by the numbers
121 severe weather events were recorded in Madison County, Indiana between 2015 and 2024.
NOAA National Centers for Environmental Information, Storm Events Database, bulk CSV export, events 2015-01-01 through 2024-12-31.Half the homes in Madison County, Indiana were built in 1965 or earlier (2020-2024 ACS 5-year).
U.S. Census Bureau, 2020-2024 American Community Survey 5-Year EstimatesMadison County, Indiana holds 59,301 housing units (2020-2024 ACS 5-year).
U.S. Census Bureau, 2020-2024 American Community Survey 5-Year EstimatesOwners occupy 70.2% of the occupied homes in Madison County, Indiana (2020-2024 ACS 5-year).
U.S. Census Bureau, 2020-2024 American Community Survey 5-Year EstimatesSevere Weather Events in Madison County
Heating and cooling equipment in Madison County works against whatever the local climate demands, and that demand is shaped by how hard the weather hits. A heat pump sized and installed for this area has to hold up to what this county actually sees, which makes local weather history part of the installation conversation.
121 severe weather events, 2015–2024. Source: NOAA National Centers for Environmental Information, Storm Events Database.