Tell us about the job
Takes about a minute. No obligation.
Sizing a heat pump for Hancock County means working from what the climate actually asks of a system, not from a catalog default. 91 severe weather events were recorded in Hancock County, Indiana between 2015 and 2024. That puts this county in a range where severe weather is a real operating variable, not a rare one, and a contractor quoting an install has to account for it in the equipment selection and the refrigerant line layout. A unit installed without that adjustment will run harder than it should in the seasons that demand the most, and the strain shows up in efficiency and component wear before the system is old.
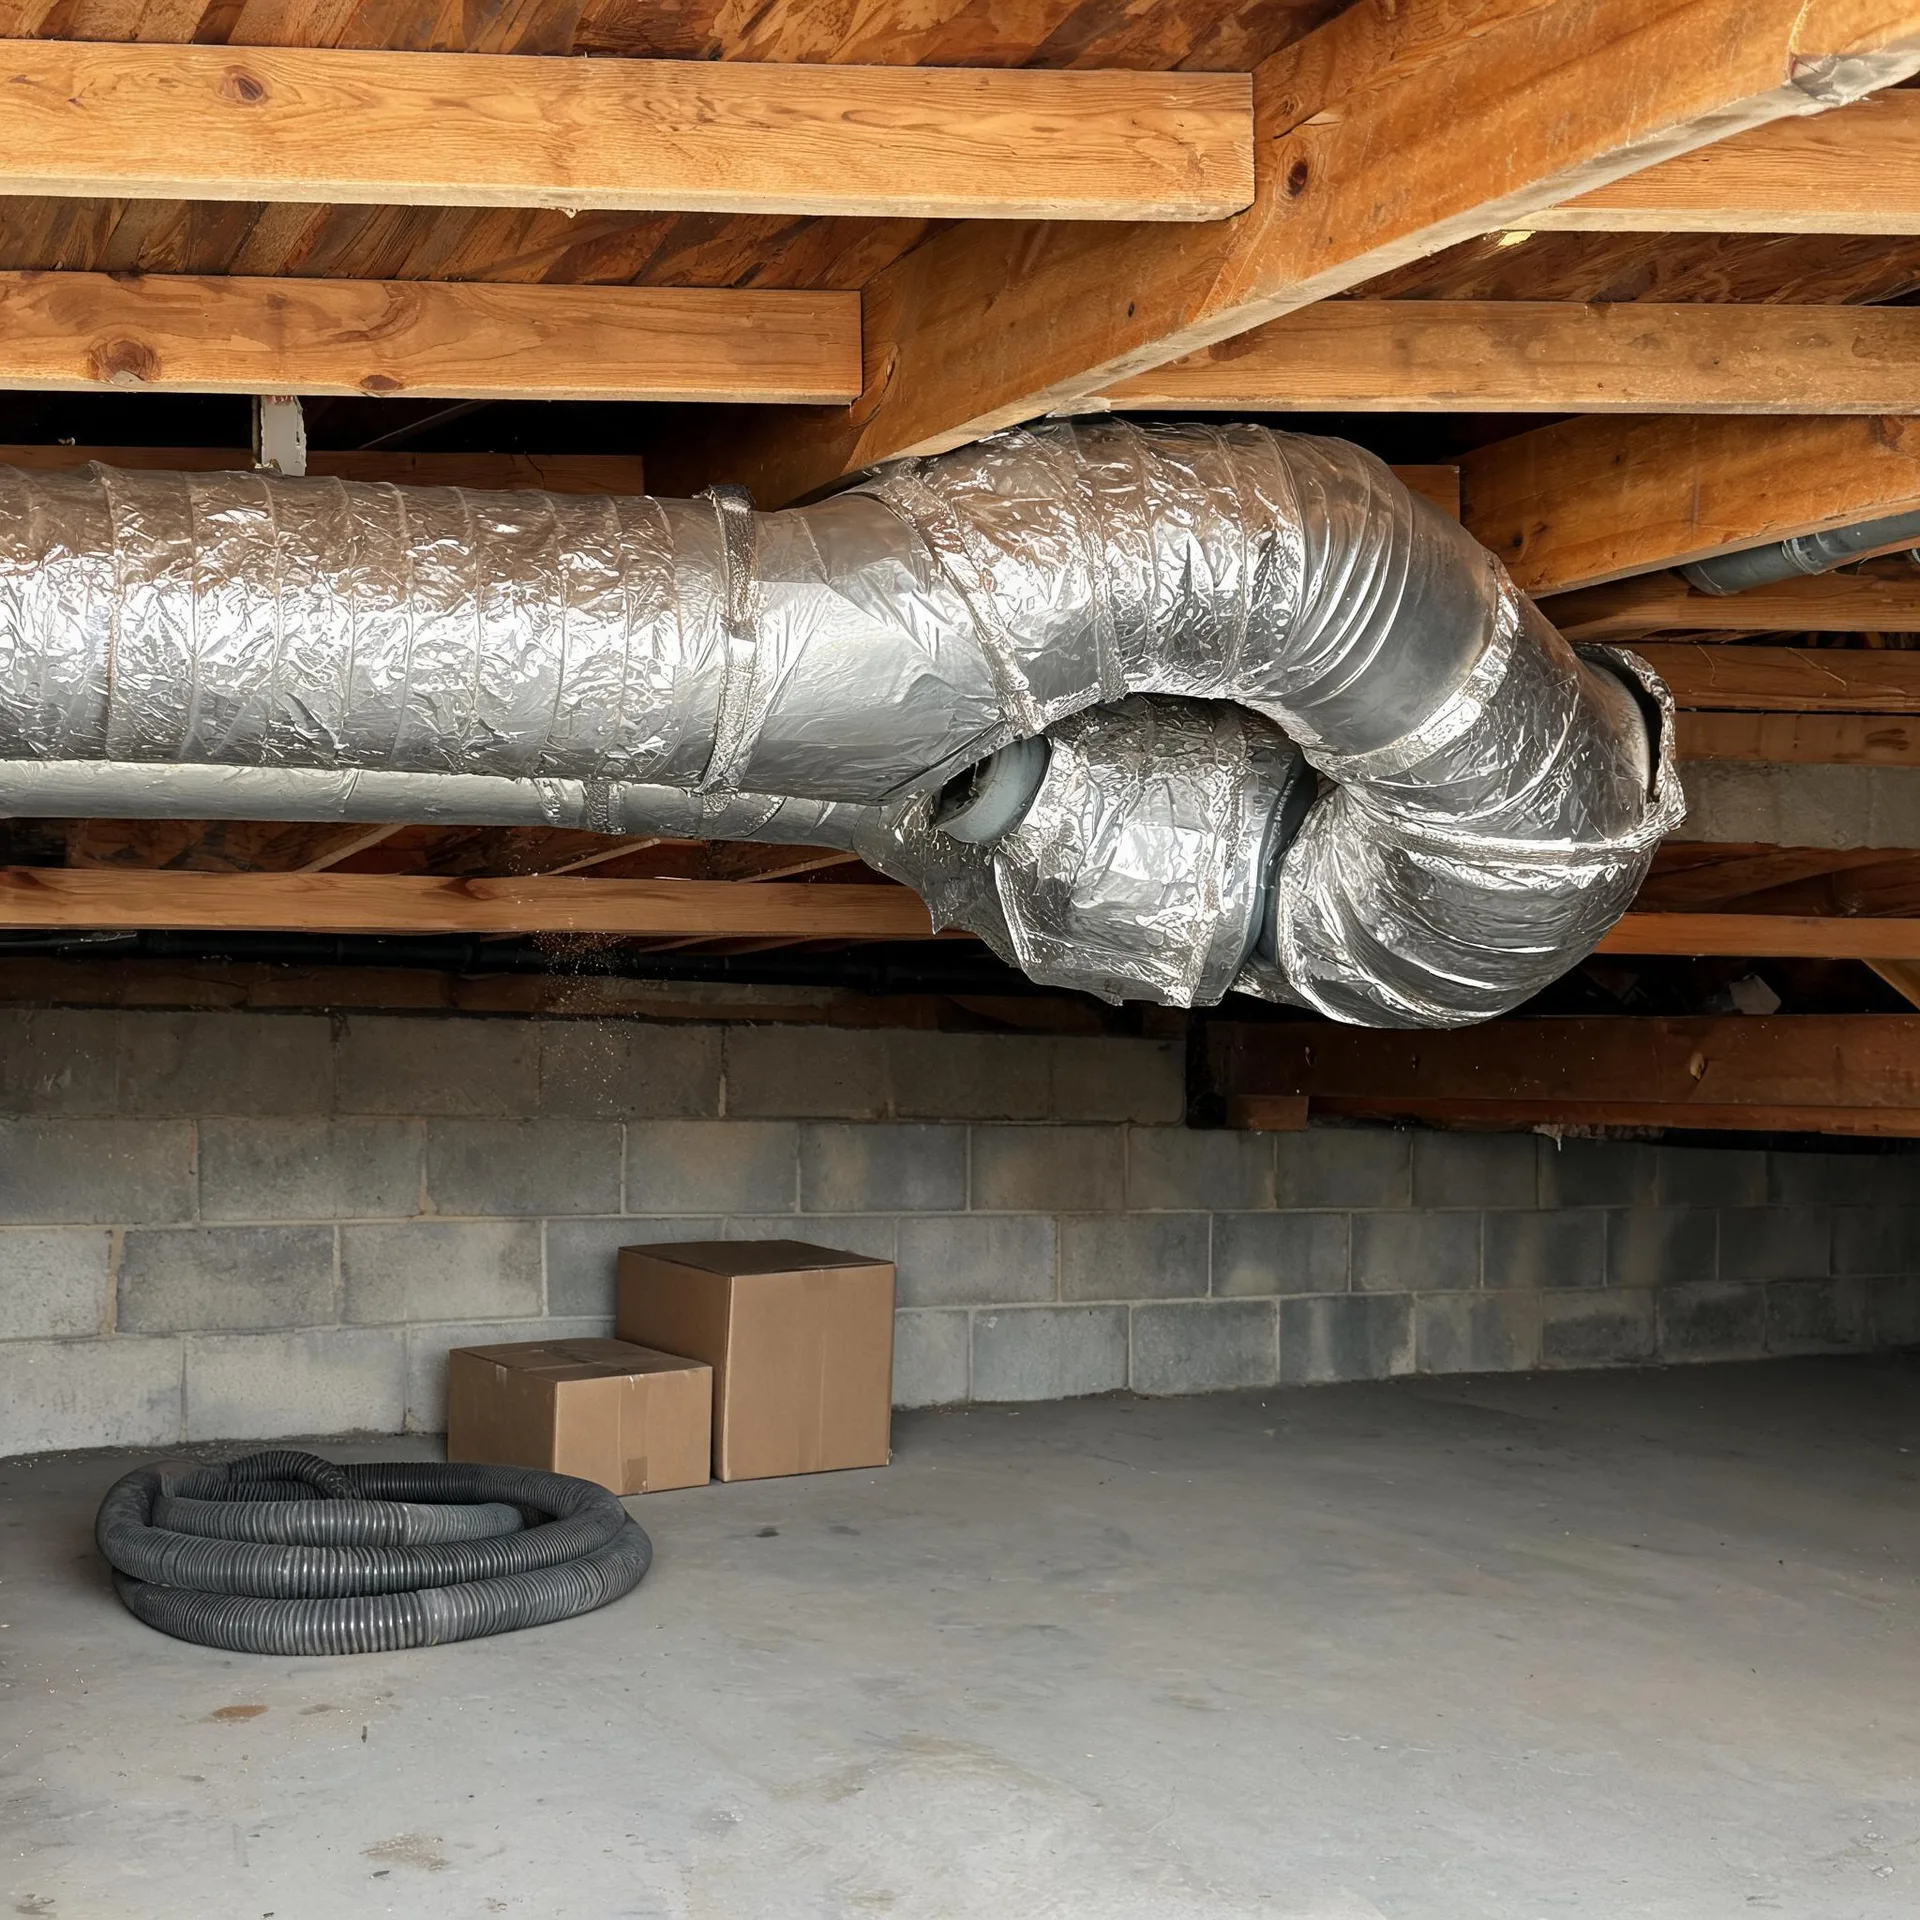
Ductwork laid out for a furnace and central air unit carries assumptions about airflow, static pressure, and register placement that do not automatically translate to a heat pump's operating profile. Half the homes in Hancock County, Indiana were built in 1991 or earlier (2020-2024 ACS 5-year). A contractor pricing a heat pump installation here has to look at what those ducts actually do before settling on equipment, because a system that runs well in one house can underperform in another where the trunk lines were sized for a different load. Electrical service is the other variable: a panel wired for older equipment may need an upgrade before a heat pump can run at full capacity.
What a Heat Pump Installation Puts in Your Home
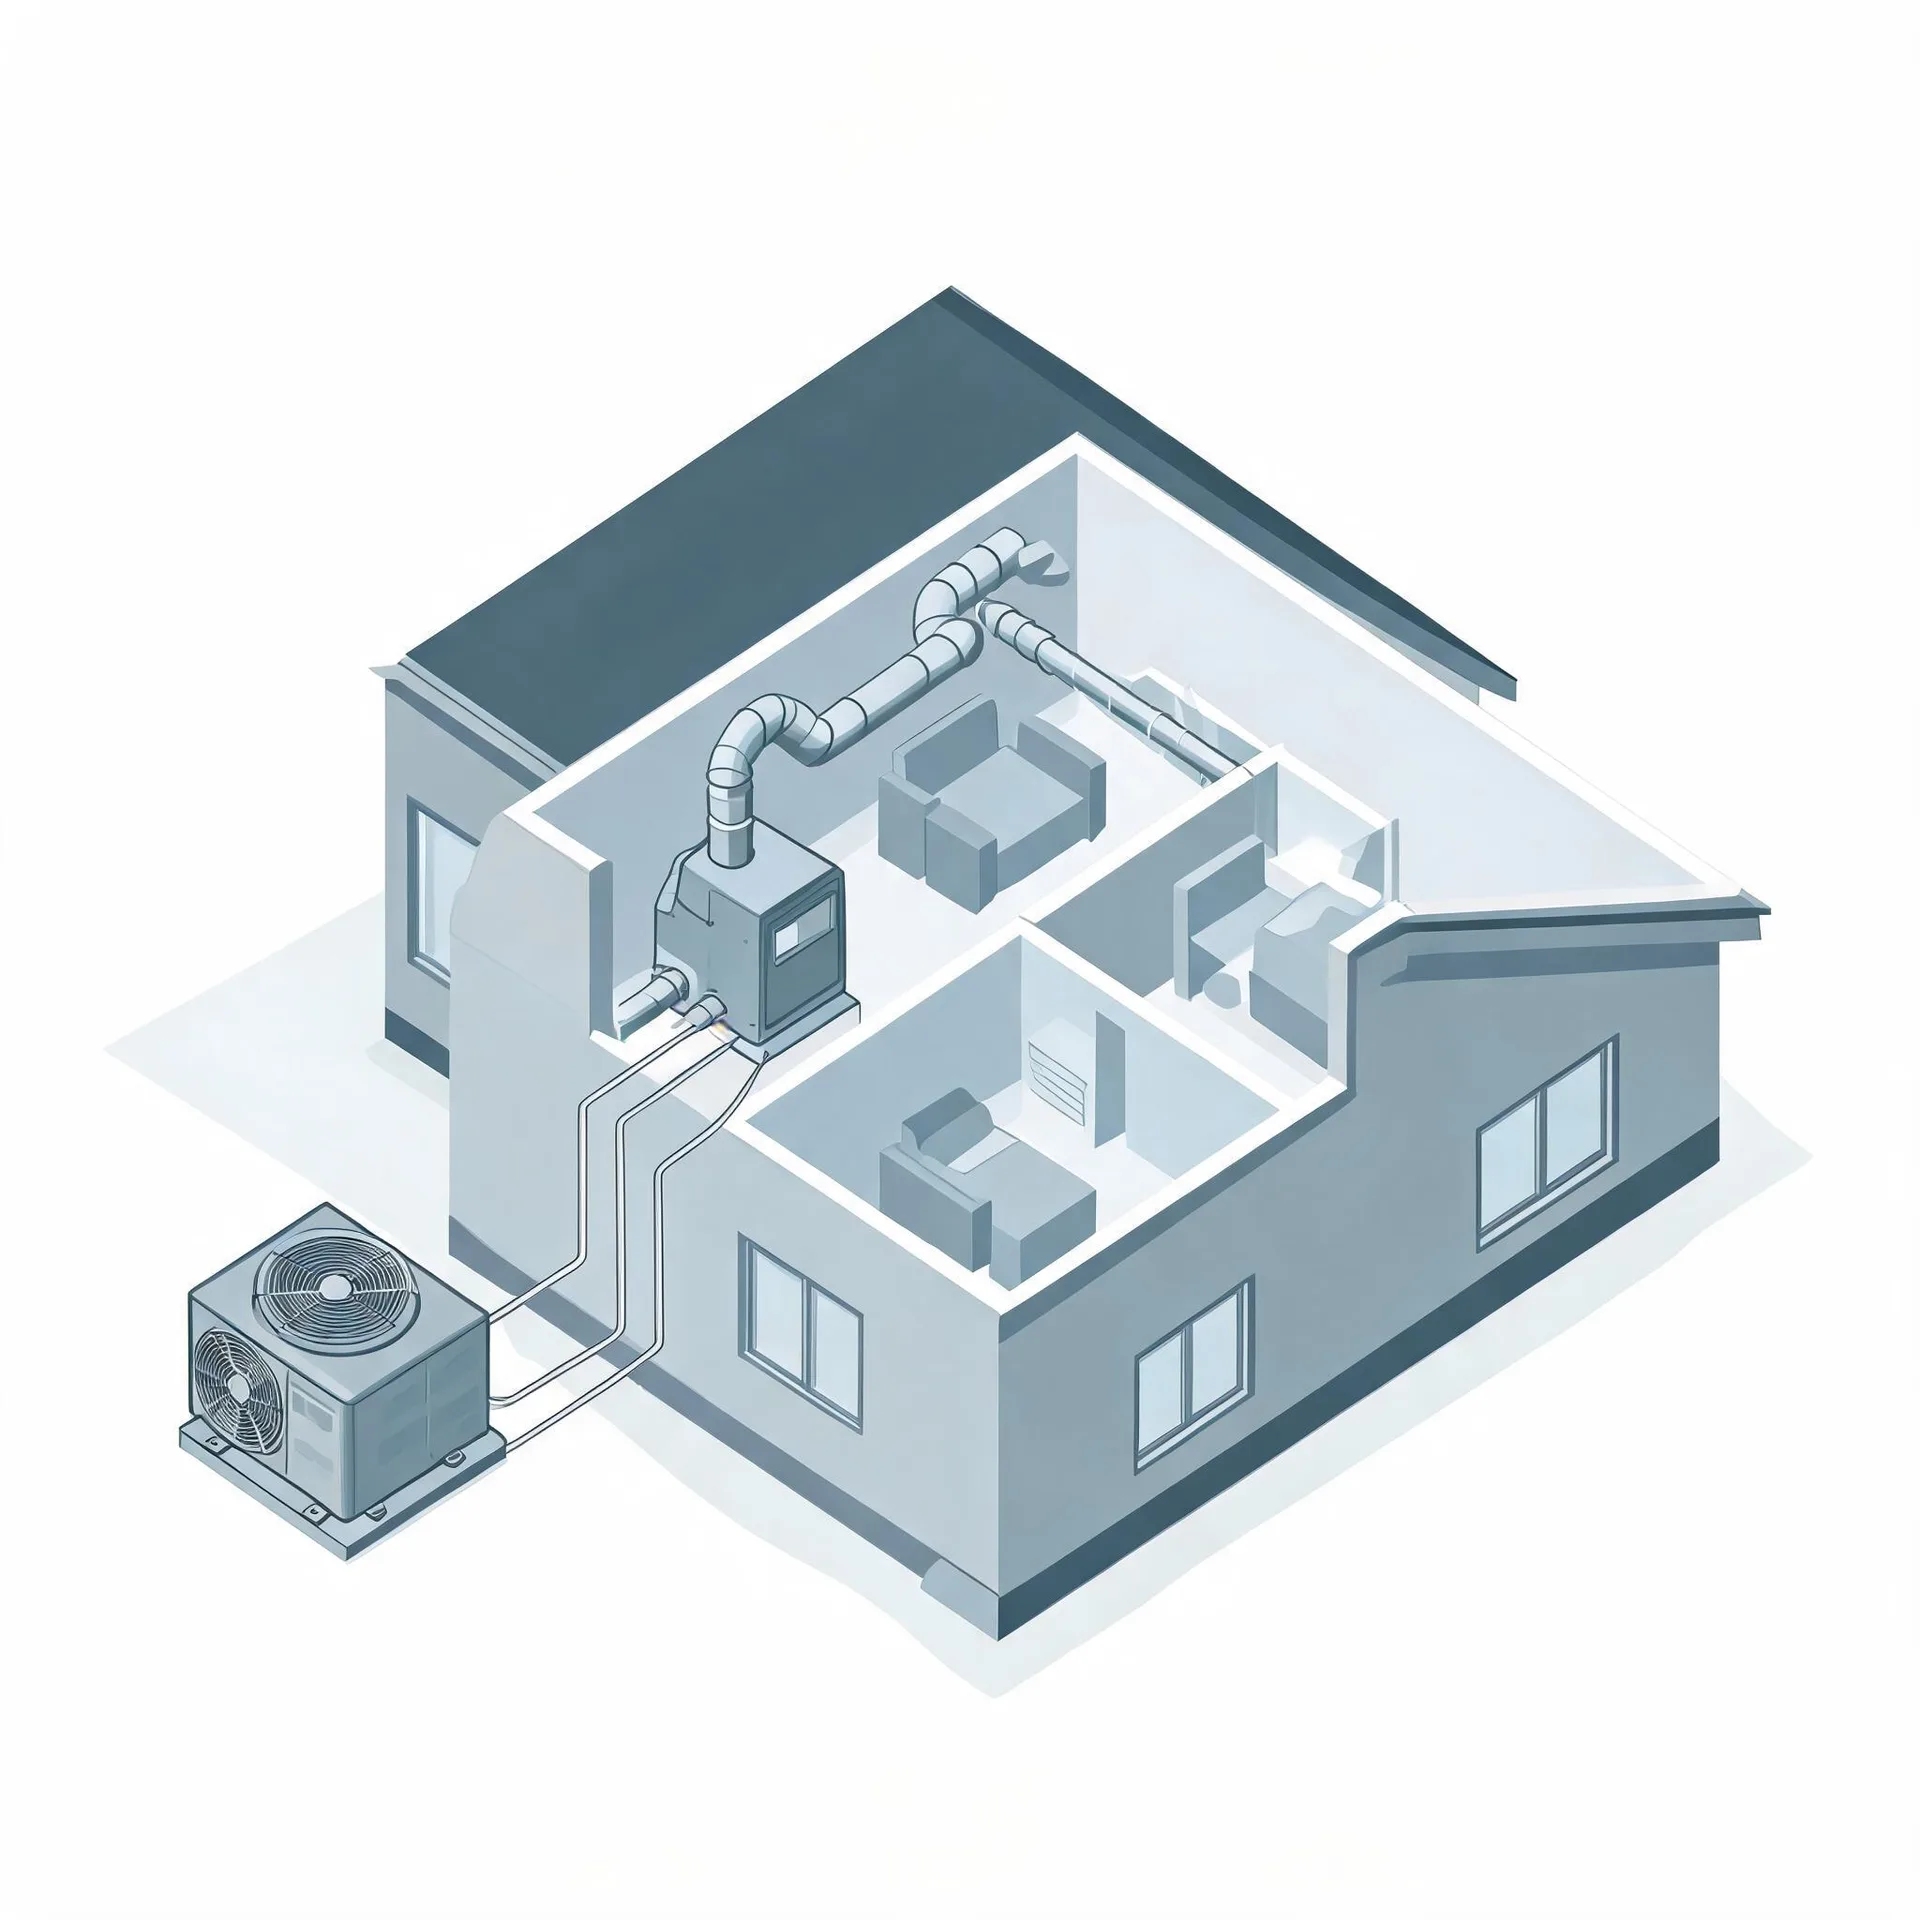
The outdoor unit sits on a pad beside the house and holds the compressor and the coil that exchange heat with the outside air. Inside, the air handler mounts in a utility space, closet, or attic and moves conditioned air through the home. These two units are the core of what a contractor installs.
A refrigerant line set runs between the outdoor unit and the air handler, carrying the refrigerant that makes the exchange possible. A thermostat goes on an interior wall where it reads the temperature of the living space and signals the system to run.
The drawing shows the general layout of a heat pump system, and a licensed contractor determines what applies to your specific home.
Find a contractor in Hancock CountyHancock County, by the numbers
91 severe weather events were recorded in Hancock County, Indiana between 2015 and 2024.
NOAA National Centers for Environmental Information, Storm Events Database, bulk CSV export, events 2015-01-01 through 2024-12-31.Half the homes in Hancock County, Indiana were built in 1991 or earlier (2020-2024 ACS 5-year).
U.S. Census Bureau, 2020-2024 American Community Survey 5-Year EstimatesHancock County, Indiana holds 34,370 housing units (2020-2024 ACS 5-year).
U.S. Census Bureau, 2020-2024 American Community Survey 5-Year EstimatesOwners occupy 79.5% of the occupied homes in Hancock County, Indiana (2020-2024 ACS 5-year).
U.S. Census Bureau, 2020-2024 American Community Survey 5-Year EstimatesSevere Weather Events in Hancock County
How hard local weather pushes a heating and cooling system shapes what that system needs to handle over its life. A heat pump sized and installed for the actual conditions here works differently than one built for a milder or more predictable climate.
91 severe weather events, 2015–2024. Source: NOAA National Centers for Environmental Information, Storm Events Database.