Tell us about the job
Takes about a minute. No obligation.

A contractor quoting a heat pump install in Miami County has to settle on sizing before anything else, and that decision rests on what the local climate actually demands, not on a worst-case assumption imported from somewhere more punishing. 60 severe weather events were recorded in Miami County, Indiana between 2015 and 2024. At that rate, severe weather is something equipment here encounters, but it does not define the operating life of a system the way it would in a county where harsh conditions are relentless. What a contractor gets right at installation, the refrigerant charge, the duct match, the electrical connections, carries more weight on the long-term performance of a heat pump here than the weather record does.
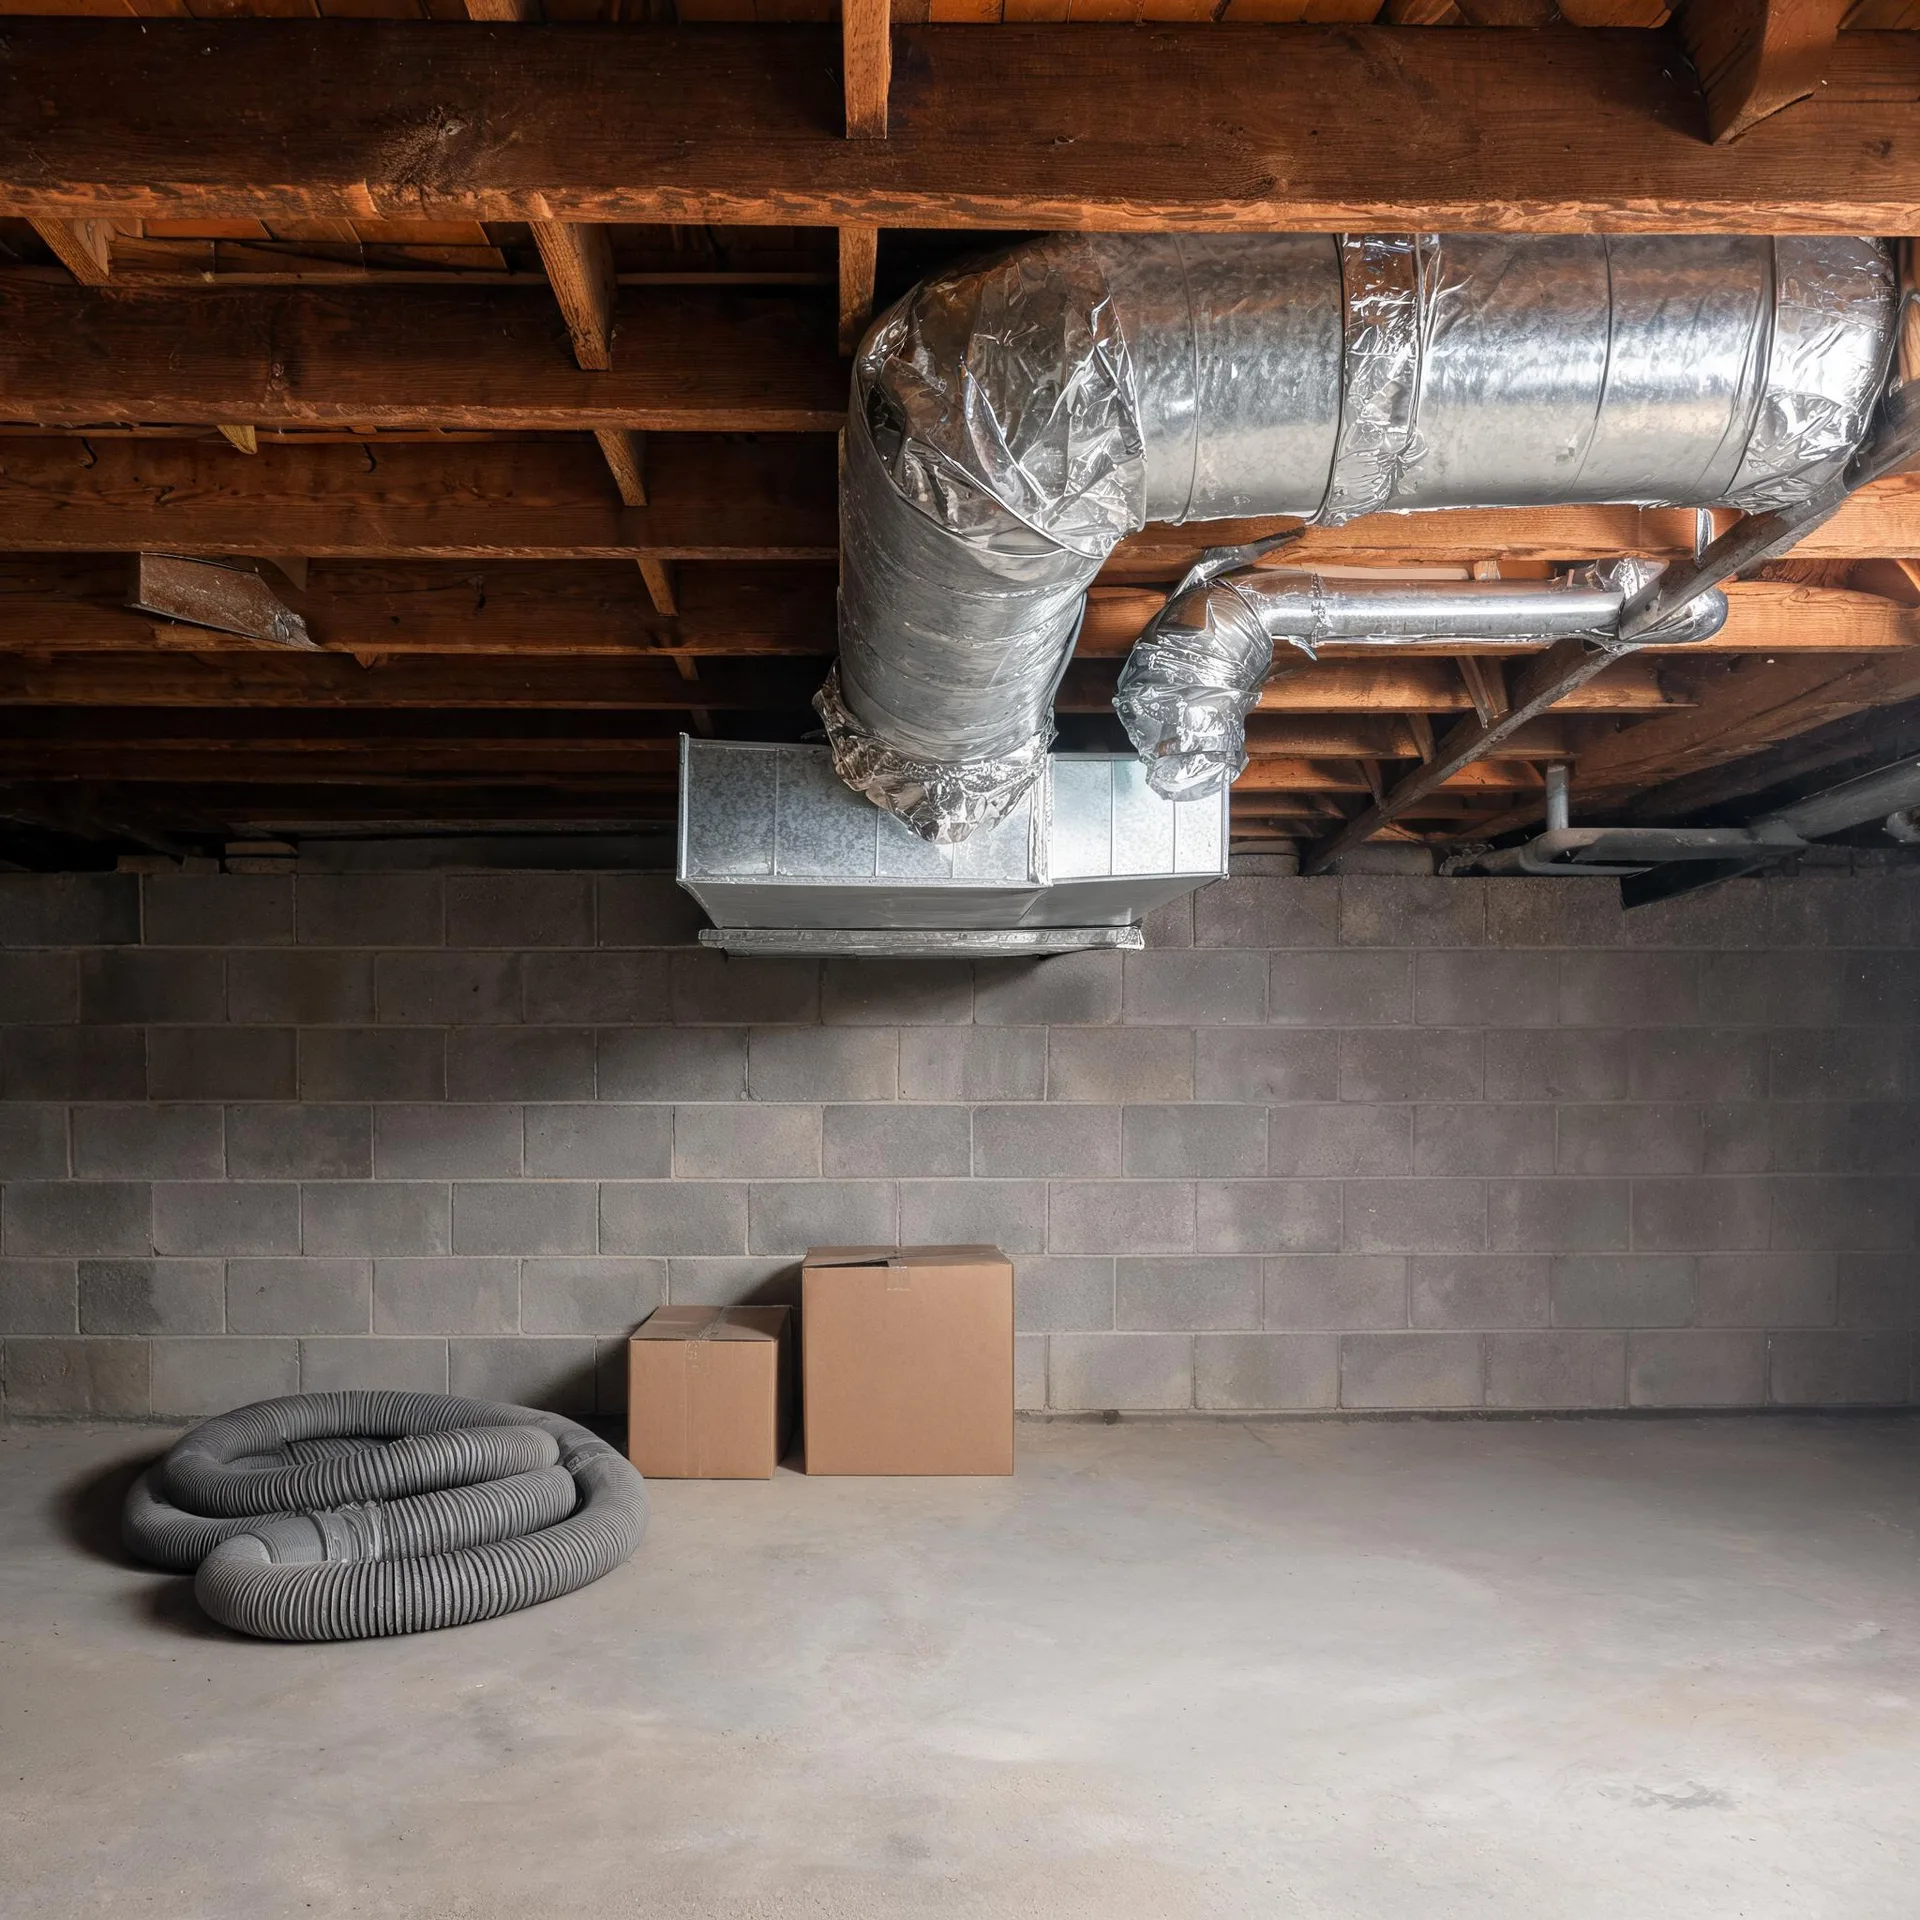
Ductwork laid in for one purpose carries a heat pump only if its sizing and routing happen to suit the new system's airflow demands. Half the homes in Miami County, Indiana were built in 1961 or earlier (2020-2024 ACS 5-year). That means a large share of the homes here were built before heat pumps were a common residential choice, and the duct runs inside them reflect that. A contractor will check what is there before anything else gets priced, because what the ducts can actually carry determines the scope of the job more directly than the unit being installed.
What a Heat Pump Installation Covers
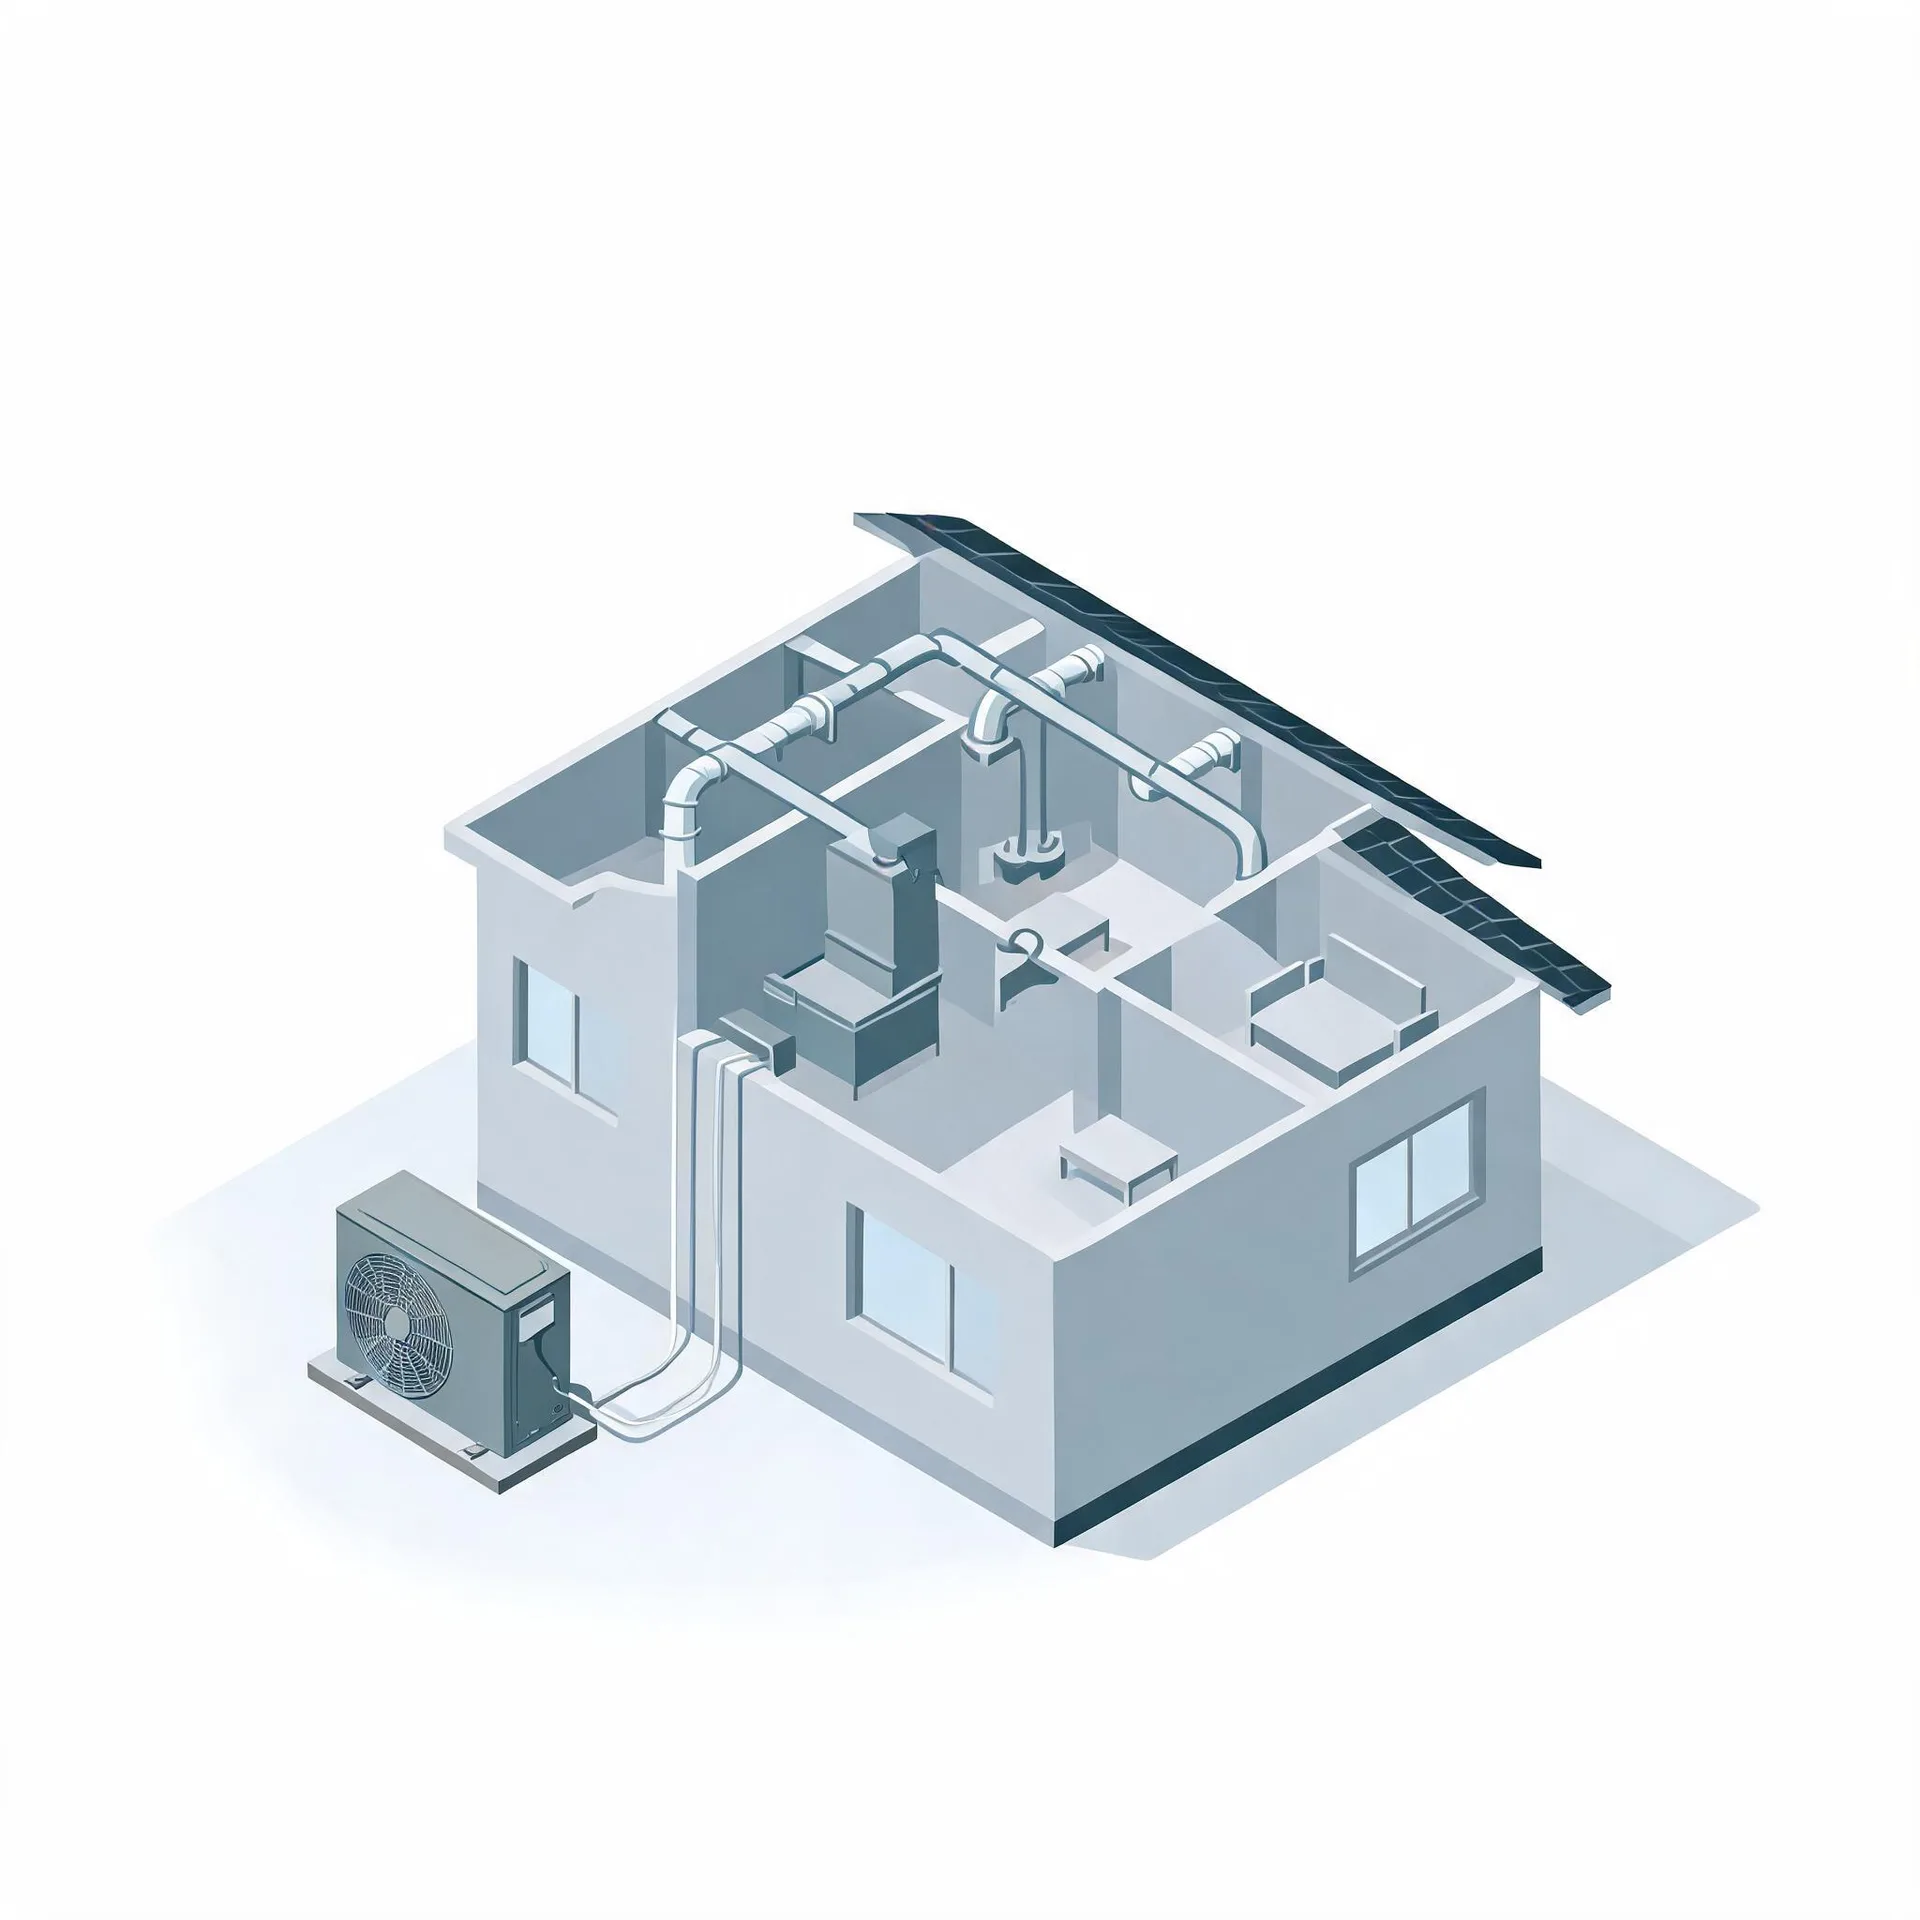
The outdoor unit is the piece most homeowners notice first. It sits on a pad outside the house and holds the compressor and the coil that pull heat from or push heat into the outside air. Inside, the air handler mounts in a utility space, basement, or closet and moves conditioned air through the home.
A refrigerant line set runs between the two units, carrying the working fluid that connects the outdoor and indoor sides of the system. A thermostat goes on an interior wall and gives the homeowner control over when and how the system runs.
The drawing shows a typical layout, and a licensed contractor determines exactly what applies to your house.
Find a contractor in Miami CountyMiami County by the Numbers
60 severe weather events were recorded in Miami County, Indiana between 2015 and 2024.
NOAA National Centers for Environmental Information, Storm Events Database, bulk CSV export, events 2015-01-01 through 2024-12-31.Half the homes in Miami County, Indiana were built in 1961 or earlier (2020-2024 ACS 5-year).
U.S. Census Bureau, 2020-2024 American Community Survey 5-Year EstimatesMiami County, Indiana holds 14,952 housing units (2020-2024 ACS 5-year).
U.S. Census Bureau, 2020-2024 American Community Survey 5-Year EstimatesOwners occupy 76.2% of the occupied homes in Miami County, Indiana (2020-2024 ACS 5-year).
U.S. Census Bureau, 2020-2024 American Community Survey 5-Year EstimatesSevere Weather Events in Miami County
Local weather puts real demands on heating and cooling equipment, and those demands shape what a heat pump here needs to handle over its working life. Sizing and installation decisions are local decisions for exactly that reason.
60 severe weather events, 2015–2024. Source: NOAA National Centers for Environmental Information, Storm Events Database.