Tell us about the job
Takes about a minute. No obligation.

Sizing a heat pump for Rush County is a local question, not a catalog answer. 91 severe weather events were recorded in Rush County, Indiana between 2015 and 2024. At that rate, severe weather is a real but occasional presence, and a system installed with poor duct sealing or an undersized refrigerant charge will fail on an ordinary summer day before a storm gets the chance. What a contractor has to settle before quoting is whether the existing load calculations reflect the house as it actually sits, because a mismatched system runs hard regardless of what the sky does.
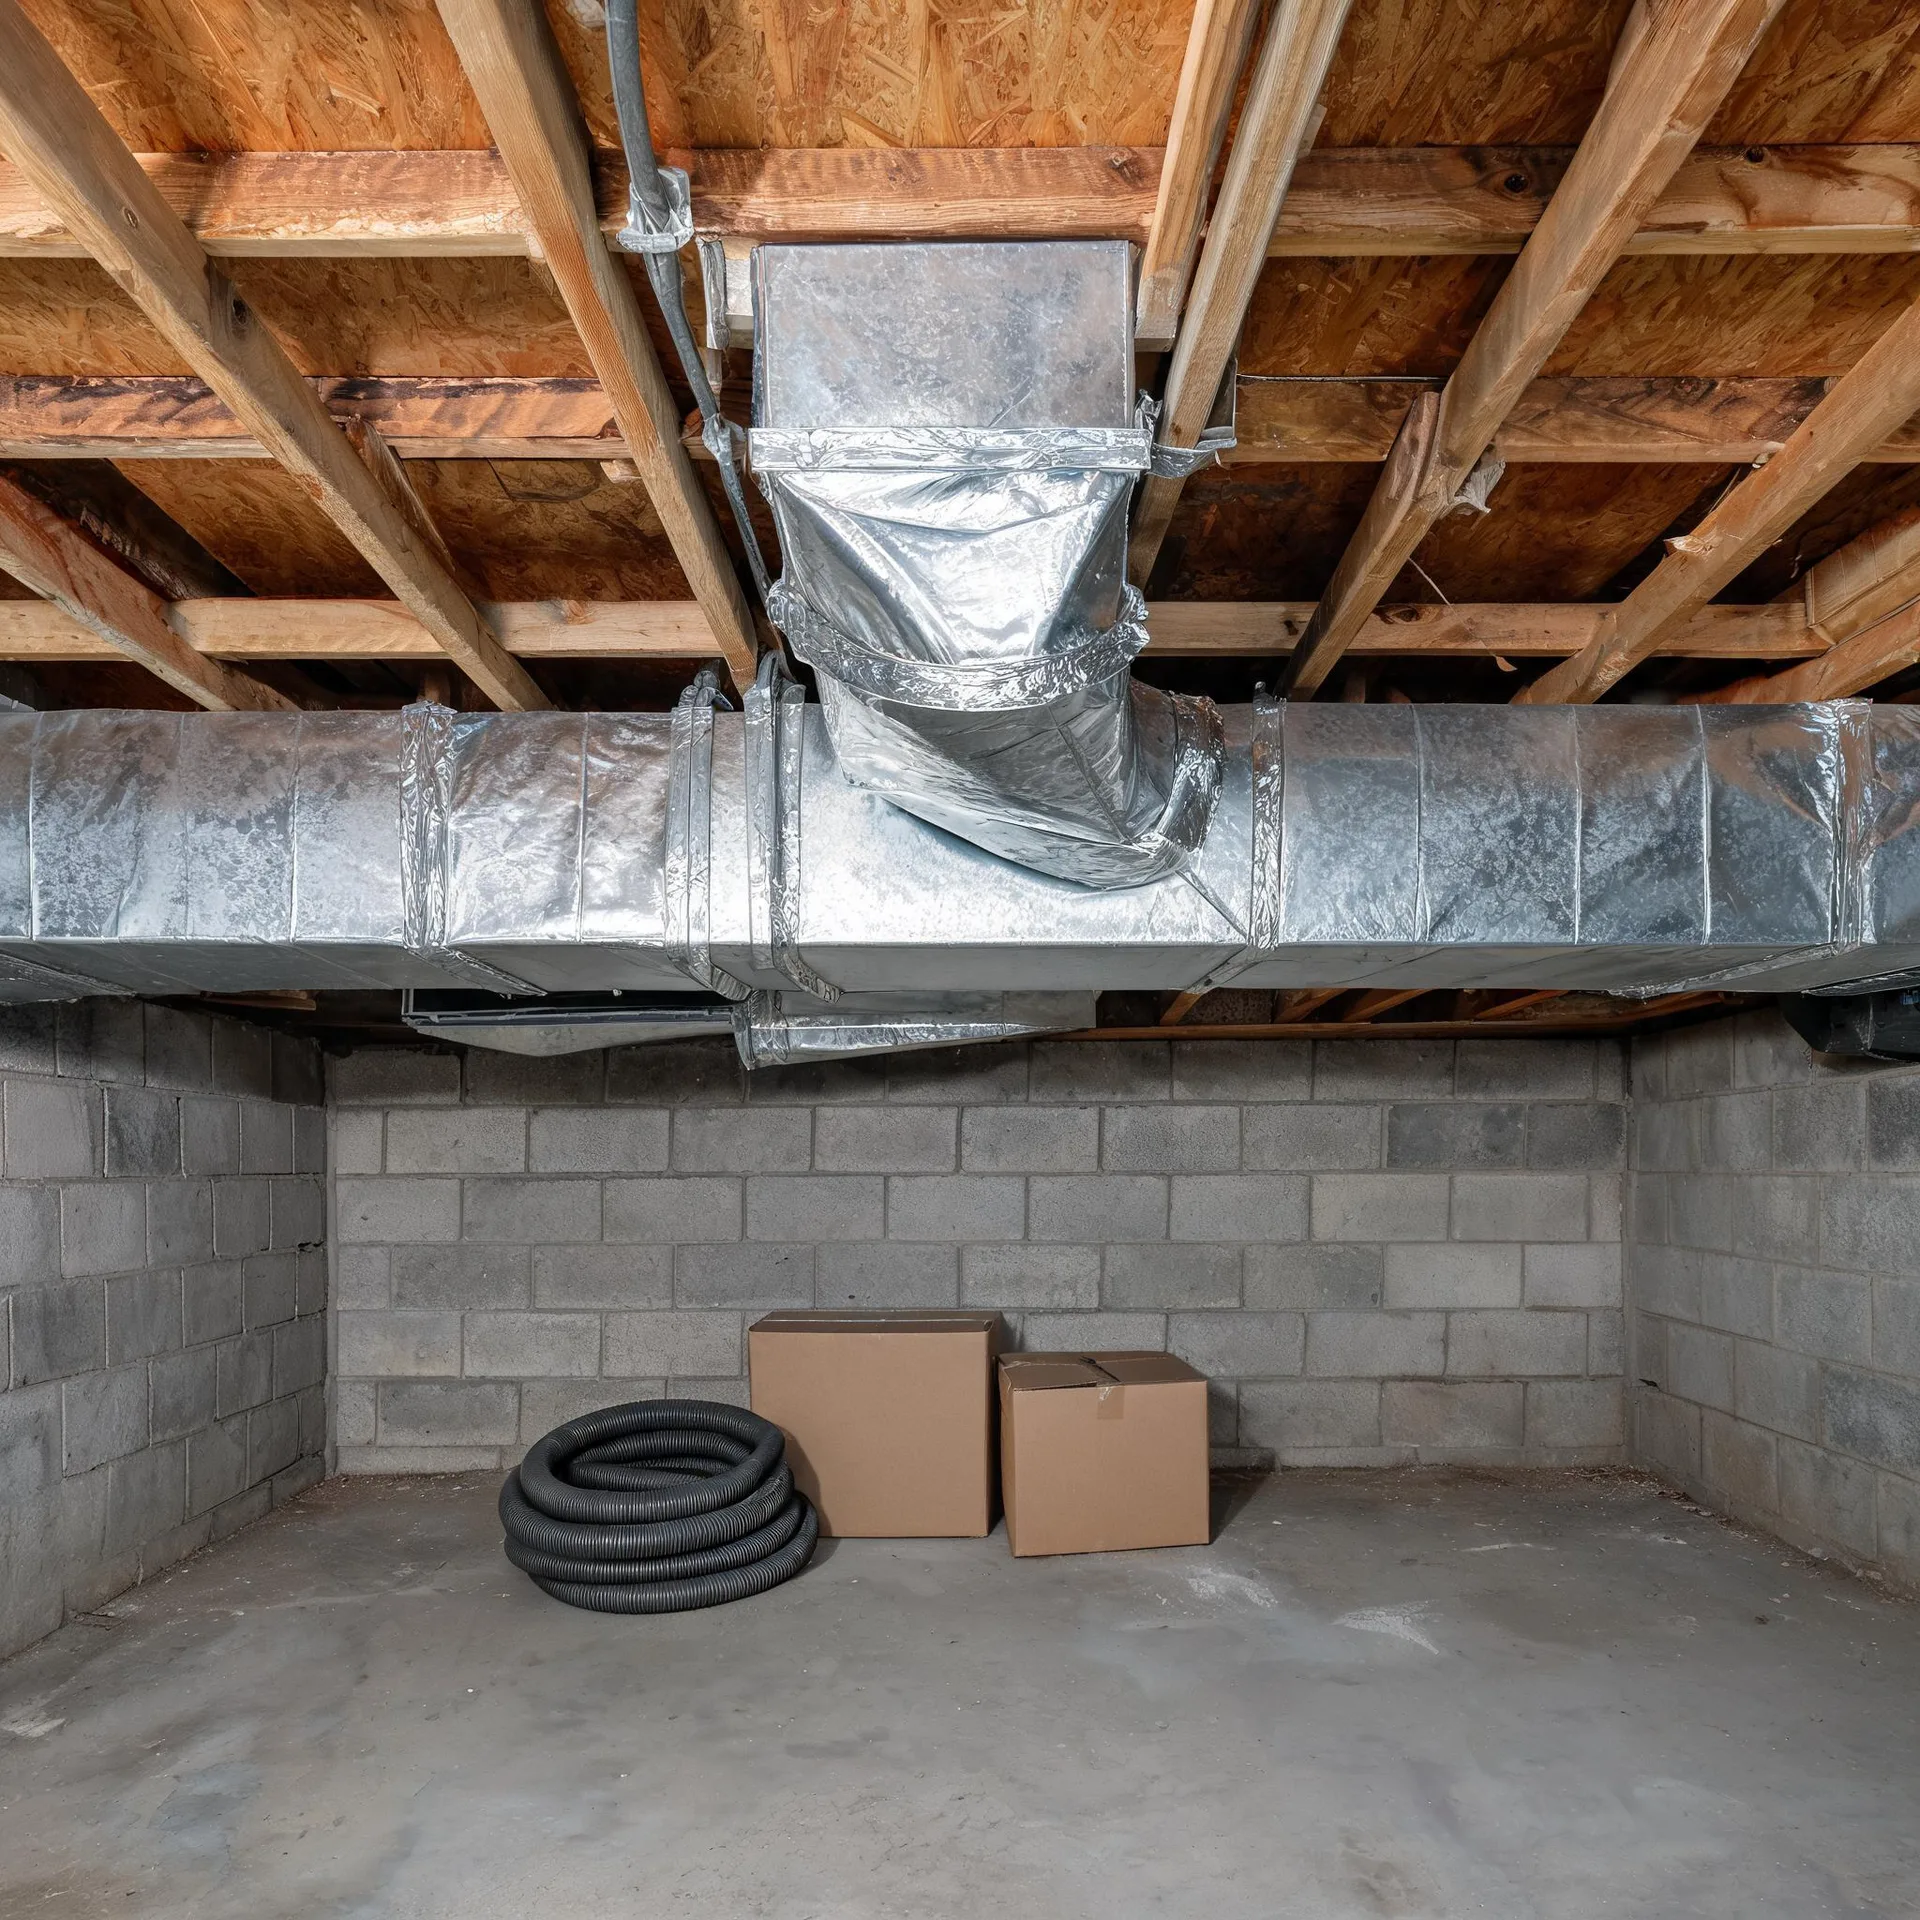
Ductwork laid down before mid-century was sized and routed for equipment with different airflow demands than a heat pump carries. Half the homes in Rush County, Indiana were built in 1954 or earlier (2020-2024 ACS 5-year). That gap between what the ducts were built for and what a new heat pump needs is where an installation job either holds together or starts expanding in scope. A contractor will measure static pressure and check trunk sizing before any unit gets specified, because a duct system that cannot move the right volume of air defeats the equipment regardless of how well it is matched on paper.
What a Heat Pump Installation Covers

The outdoor unit sits on a pad beside the house and holds the compressor and coil that do the core work of the system. Inside, an air handler mounts in a utility space, basement, or closet and moves conditioned air through the home. These two units are what a contractor brings in and sets in place.
A refrigerant line set runs between the outdoor unit and the air handler, connecting the two so they function as a single system. A thermostat mounts on an interior wall and gives the household a single point of control over the whole setup.
The drawing shows a general layout of these components, and a licensed contractor determines exactly what applies to your house.
Find a contractor in Rush CountyRush County, Indiana, by the numbers
91 severe weather events were recorded in Rush County, Indiana between 2015 and 2024.
NOAA National Centers for Environmental Information, Storm Events Database, bulk CSV export, events 2015-01-01 through 2024-12-31.Half the homes in Rush County, Indiana were built in 1954 or earlier (2020-2024 ACS 5-year).
U.S. Census Bureau, 2020-2024 American Community Survey 5-Year EstimatesRush County, Indiana holds 7,387 housing units (2020-2024 ACS 5-year).
U.S. Census Bureau, 2020-2024 American Community Survey 5-Year EstimatesOwners occupy 74.9% of the occupied homes in Rush County, Indiana (2020-2024 ACS 5-year).
U.S. Census Bureau, 2020-2024 American Community Survey 5-Year EstimatesSevere Weather Events in Rush County
Heating and cooling equipment in Rush County works against whatever the local climate throws at it, and that workload shapes what a heat pump here needs to handle. How hard conditions bear down on a home determines how hard the equipment must work, which makes local weather history a practical factor in any installation decision.
91 severe weather events, 2015–2024. Source: NOAA National Centers for Environmental Information, Storm Events Database.