Tell us about the job
Takes about a minute. No obligation.
A contractor quoting a heat pump install in Randolph County starts with the site, not the forecast. 54 severe weather events were recorded in Randolph County, Indiana between 2015 and 2024. At that rate, severe weather here is a periodic interruption rather than a standing condition, which means the sizing decisions and installation standards that govern how a system runs day to day carry more weight than storm exposure. A unit that was under-sized at install, or whose refrigerant lines were run sloppily, will underperform in ways that have nothing to do with the seasons. The contractor's first job is getting those variables right.
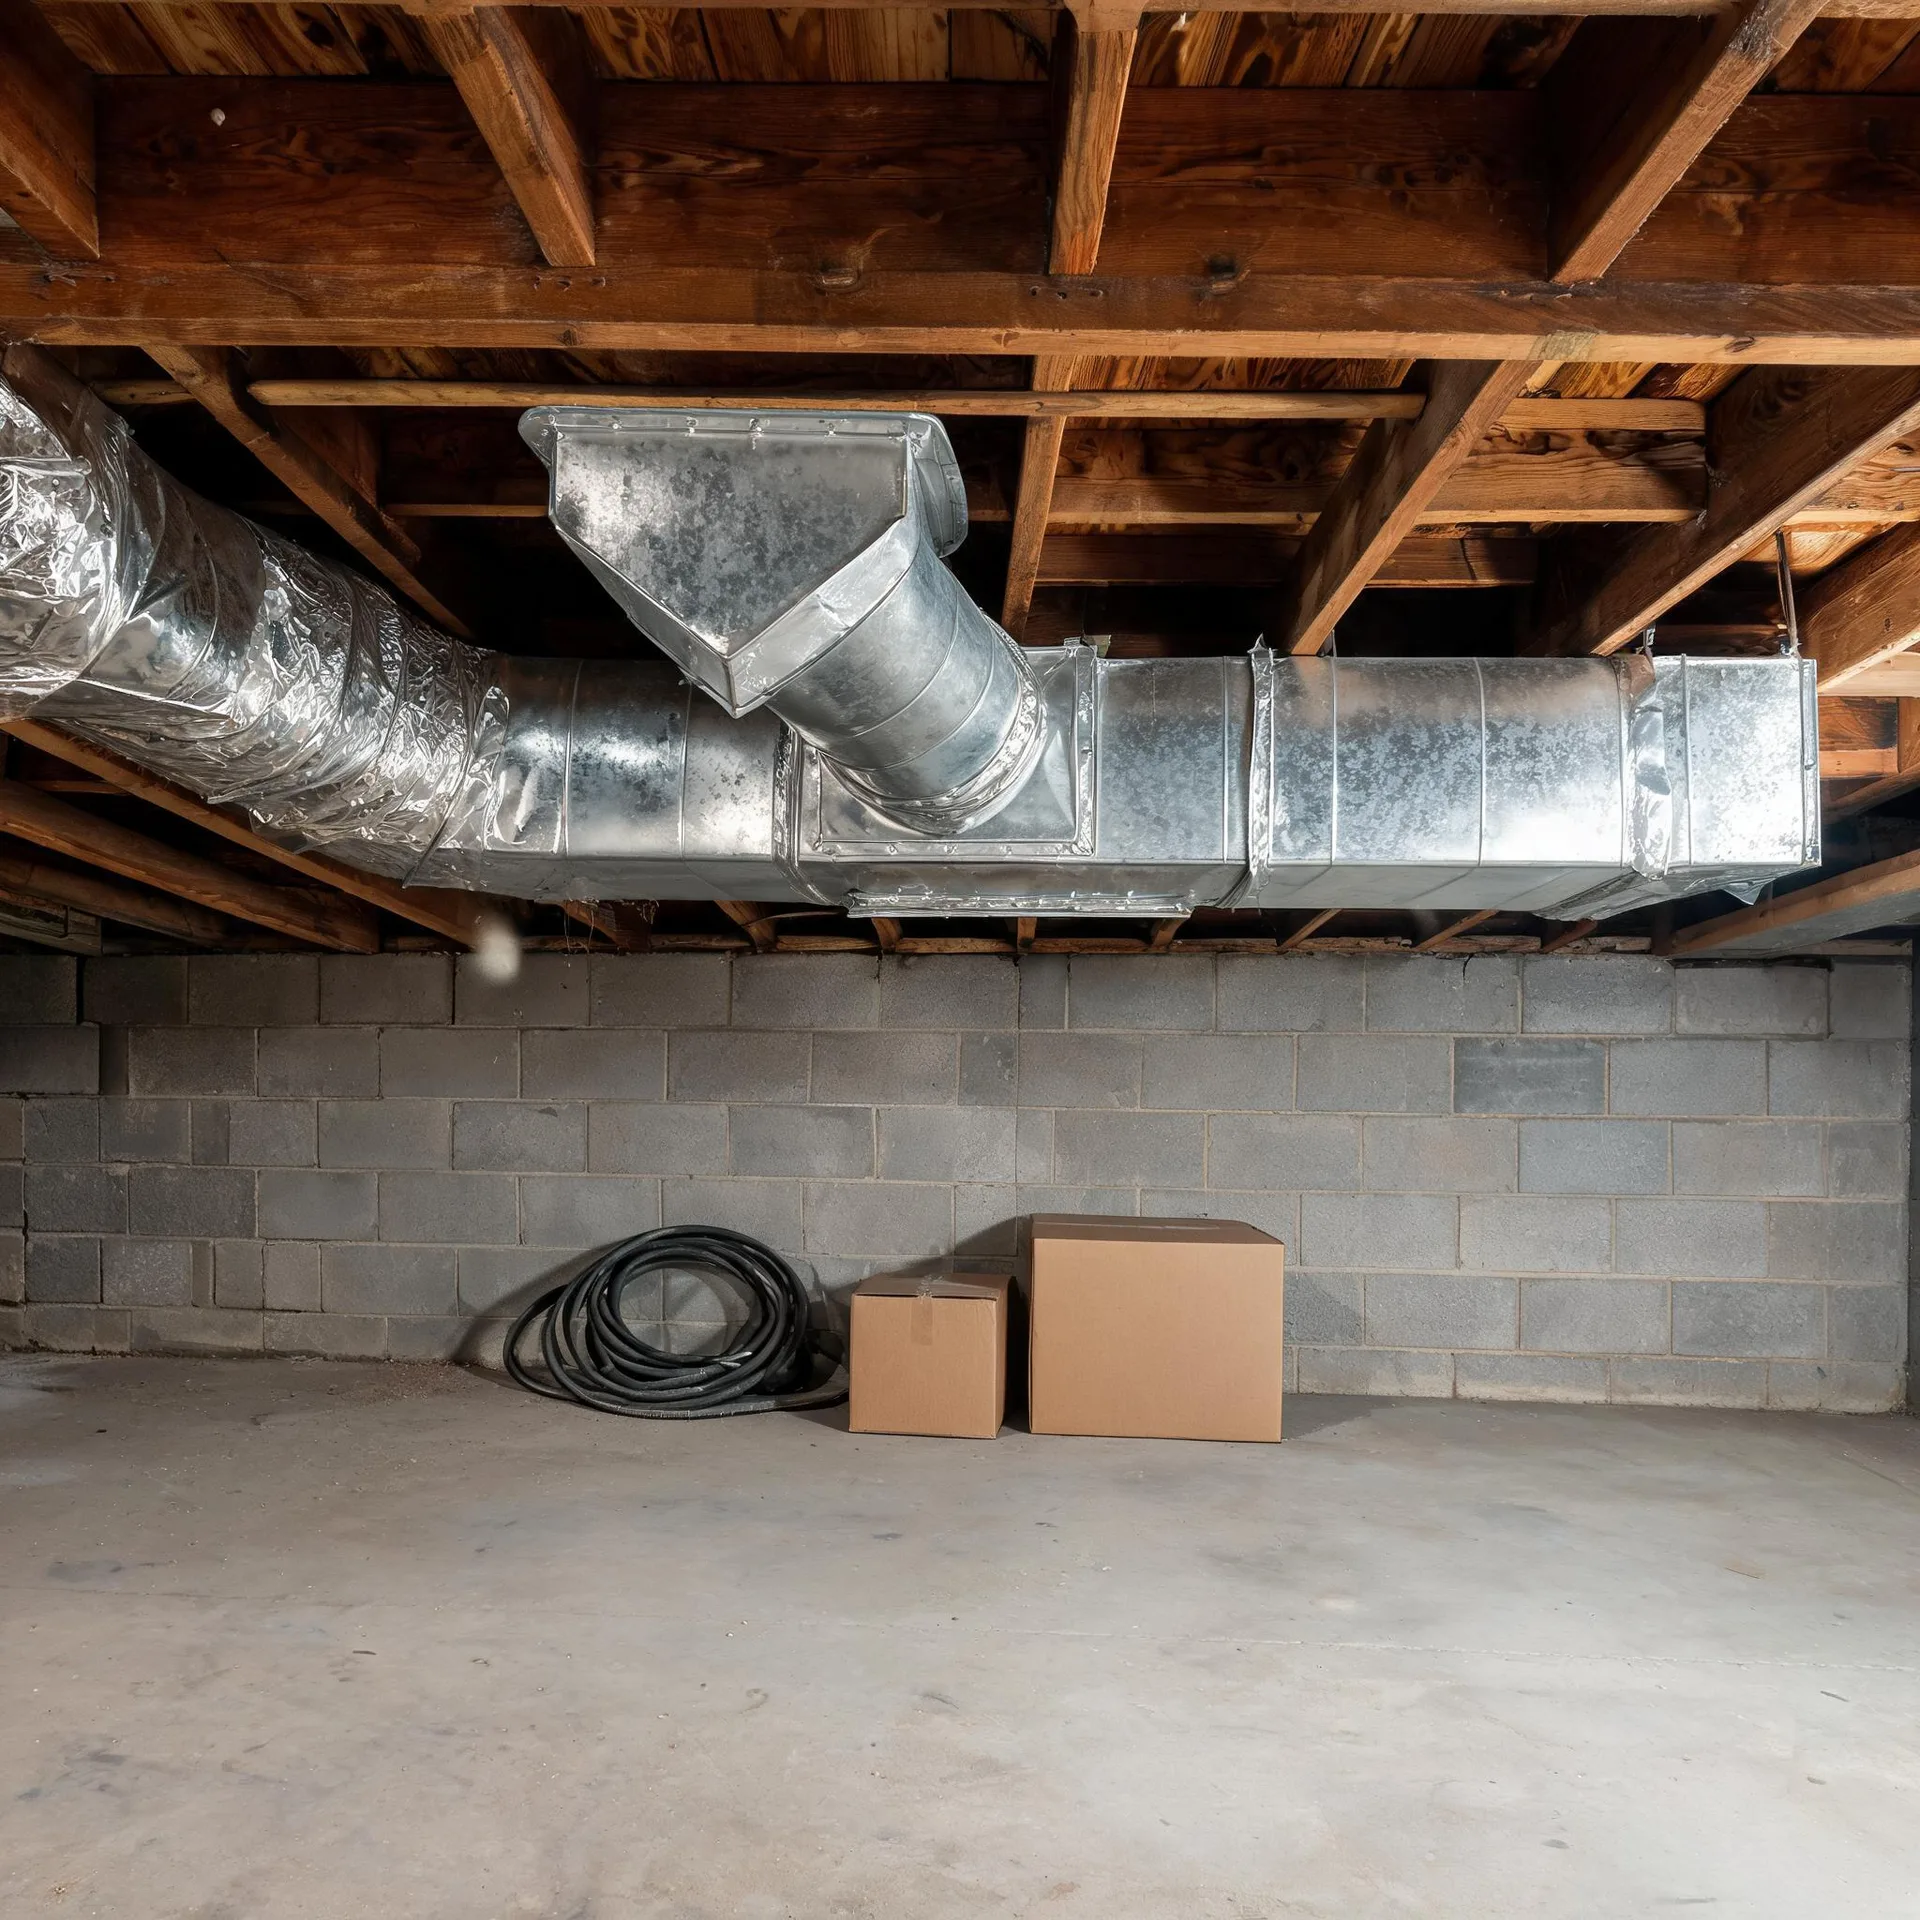
Ductwork in a house built for an older heating system was sized and routed for that system. Half the homes in Randolph County, Indiana were built in 1958 or earlier (2020-2024 ACS 5-year). When a contractor quotes a heat pump installation in Randolph County, the duct layout gets checked before anything else, because a heat pump moves air differently than what most of this stock was originally built around. If the existing runs cannot carry the required airflow, the installation scope changes before a unit is ever priced.
What a Heat Pump Looks Like as a Complete System
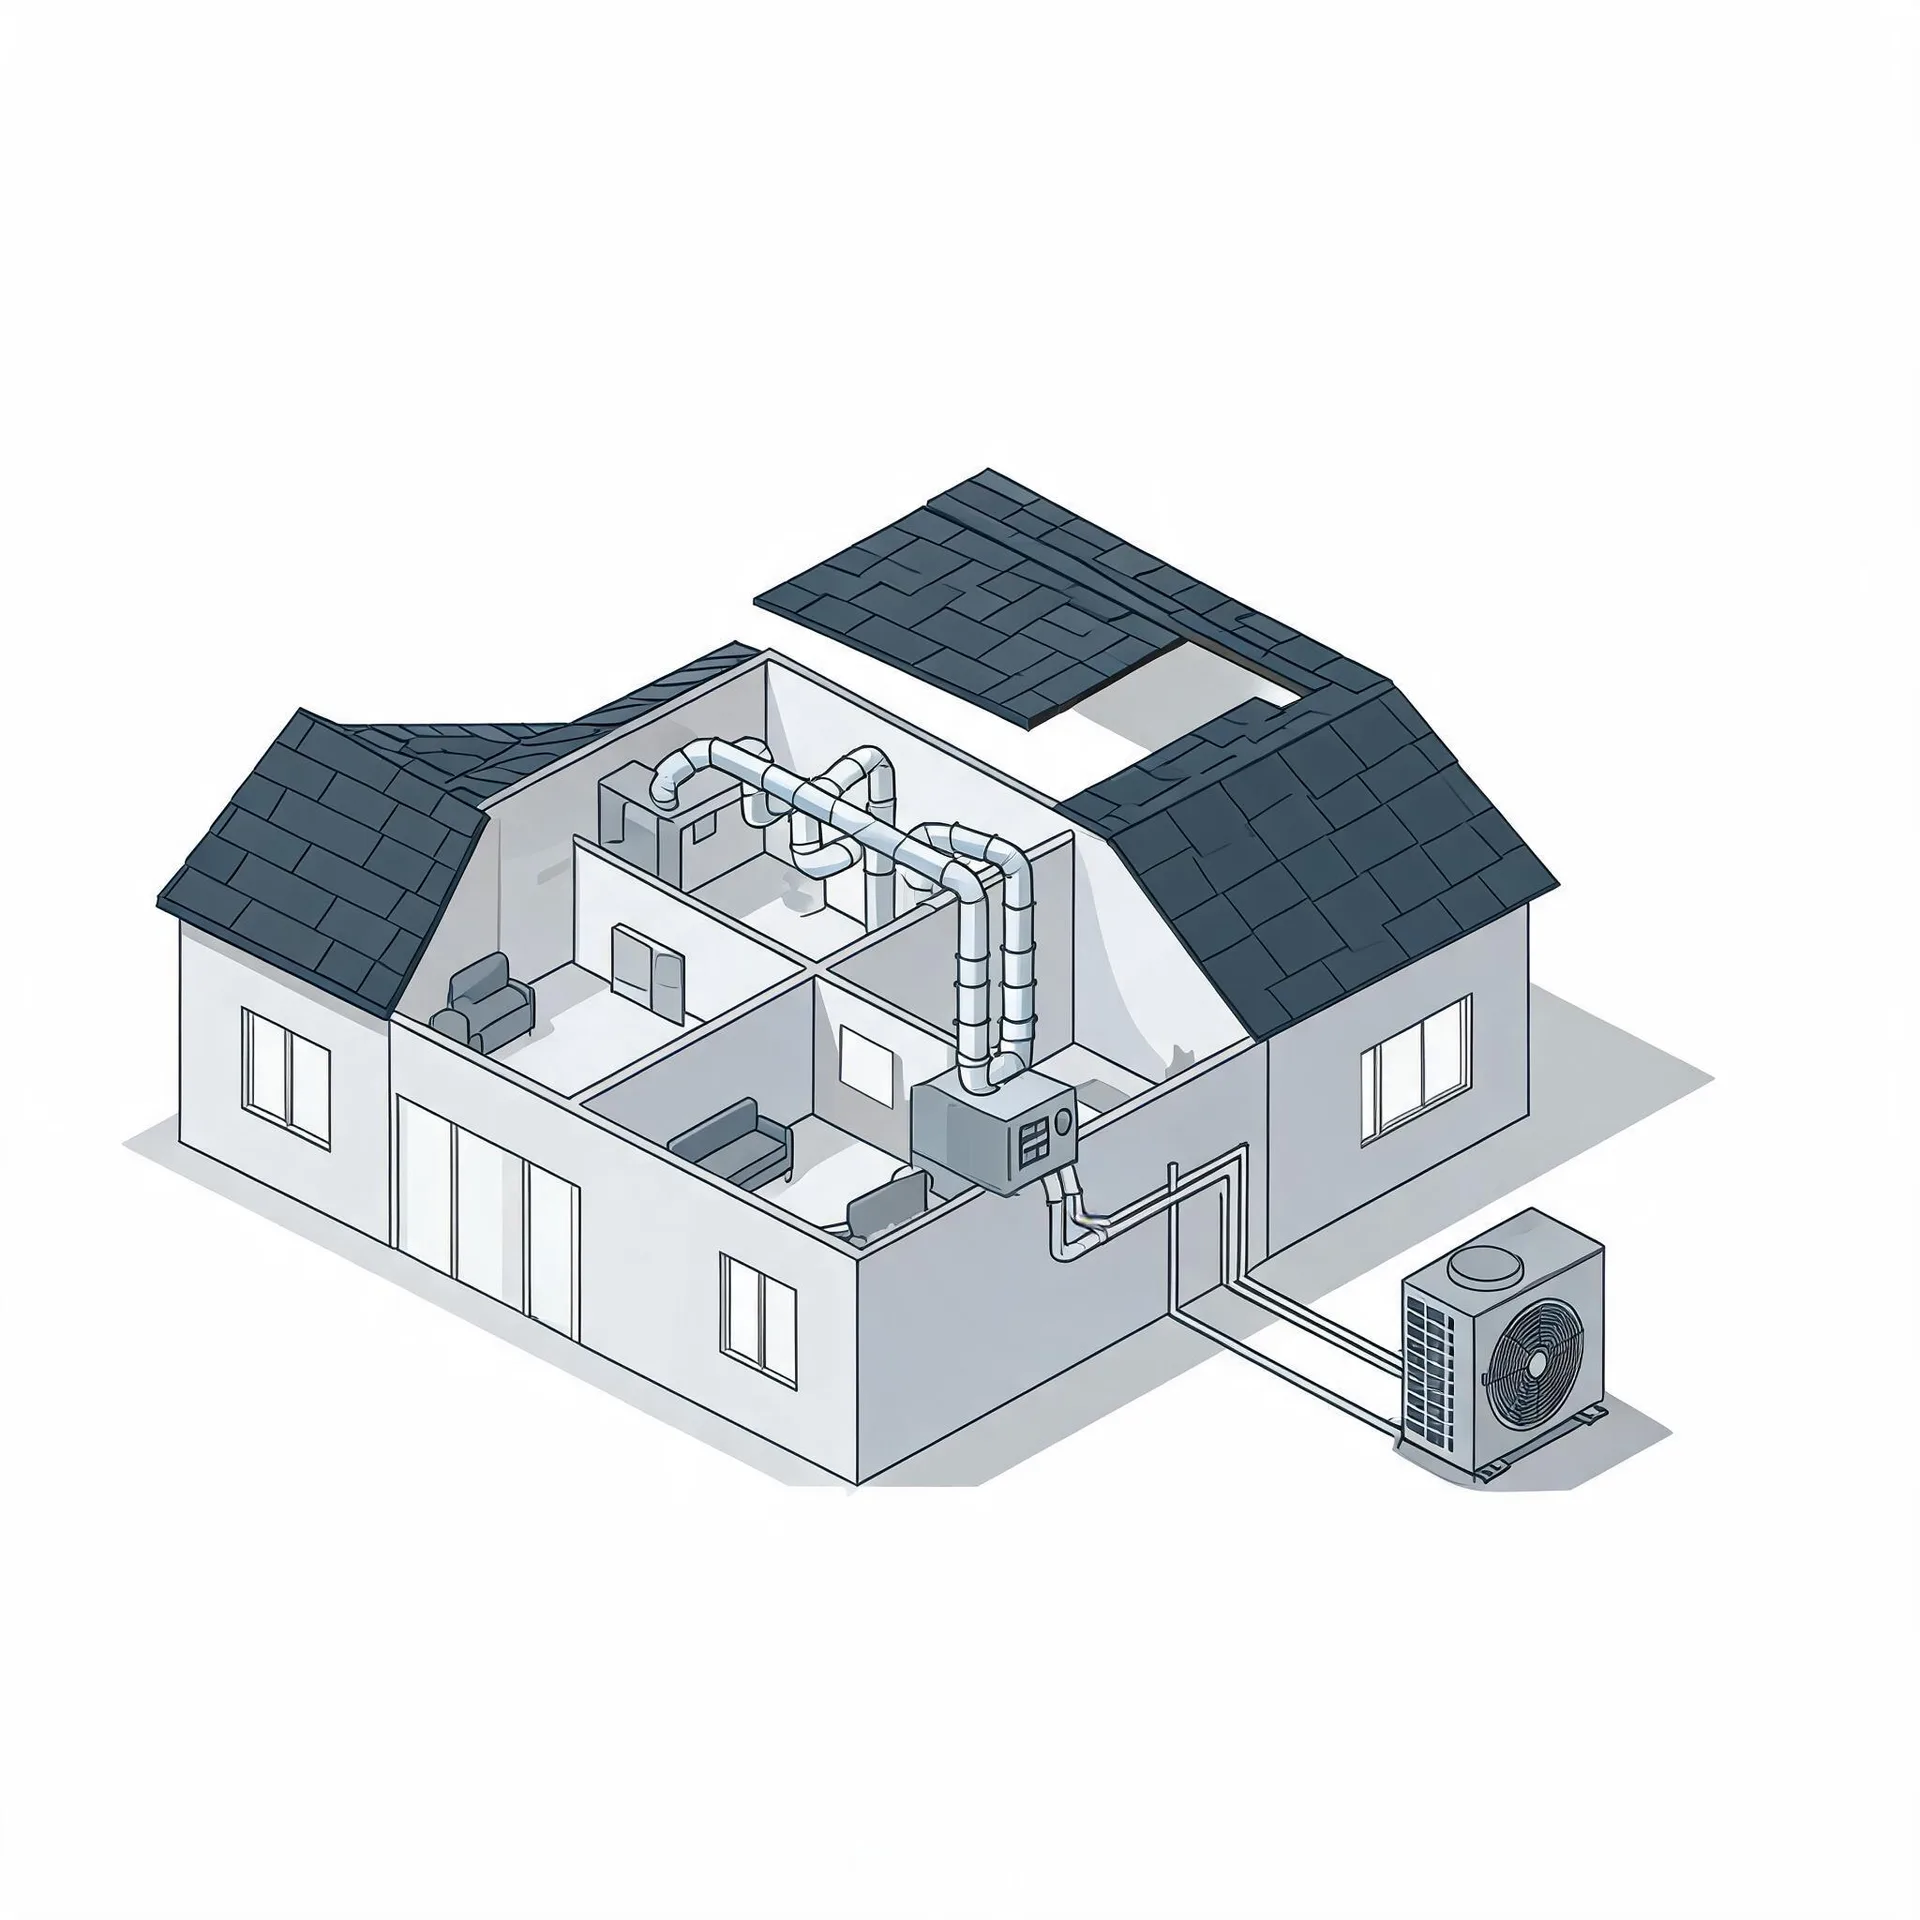
The outdoor unit sits on a pad beside the house and holds the compressor and the main coil. Inside, an air handler mounts in a utility space, a closet, or an attic and moves conditioned air through the home. These two units are what a homeowner is buying when a heat pump goes in.
A refrigerant line set runs between the outdoor unit and the air handler, carrying the working fluid that makes the two ends of the system one. A thermostat on an interior wall ties the whole arrangement together and gives the homeowner control over when and how the system runs.
The drawing shows a general layout of these components, and a licensed contractor determines exactly how each one applies to your house.
Find a contractor in Randolph CountyRandolph County, by the numbers
54 severe weather events were recorded in Randolph County, Indiana between 2015 and 2024.
NOAA National Centers for Environmental Information, Storm Events Database, bulk CSV export, events 2015-01-01 through 2024-12-31.Half the homes in Randolph County, Indiana were built in 1958 or earlier (2020-2024 ACS 5-year).
U.S. Census Bureau, 2020-2024 American Community Survey 5-Year EstimatesRandolph County, Indiana holds 11,412 housing units (2020-2024 ACS 5-year).
U.S. Census Bureau, 2020-2024 American Community Survey 5-Year EstimatesOwners occupy 77.3% of the occupied homes in Randolph County, Indiana (2020-2024 ACS 5-year).
U.S. Census Bureau, 2020-2024 American Community Survey 5-Year EstimatesSevere Weather Events in Randolph County
Weather in Randolph County puts real load on heating and cooling equipment, and that load shapes what a heat pump needs to handle year after year. Sizing and installation choices are local decisions, and the recorded weather history here is part of that picture.
54 severe weather events, 2015–2024. Source: NOAA National Centers for Environmental Information, Storm Events Database.